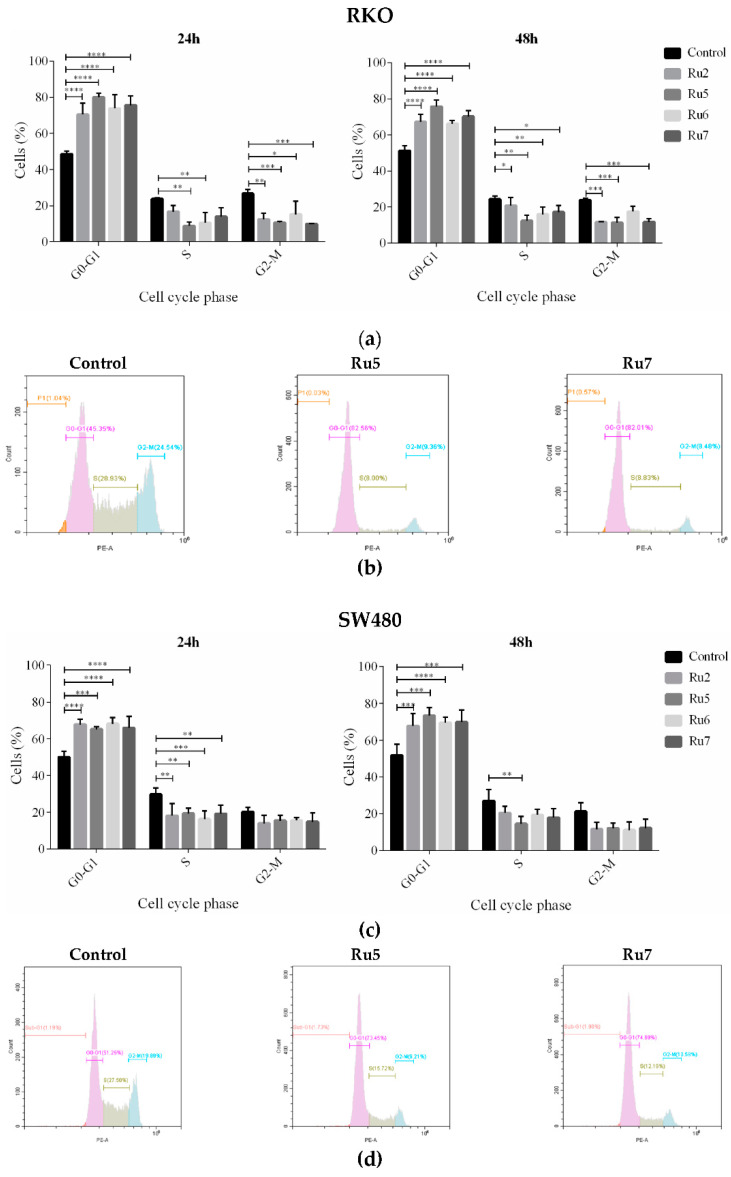
Figure 5.
Analysis of cell-cycle phase distribution after 24 and 48 h of incubation with IC50 concentrations in RKO (a) and SW480 (c) cell lines. Flow cytometry histograms of the FL2 red channel reading fluorescence of RKO (b) and SW480 (d) cells incubated with IC50 concentrations of Ru5 and Ru7 complexes for 48 h and stained with propidium iodide. Results were expressed as mean ± SD of at least three independent experiments. Results were statistically different from the negative control for * p < 0.05, ** p < 0.01, *** p < 0.001 and **** p < 0.0001.

