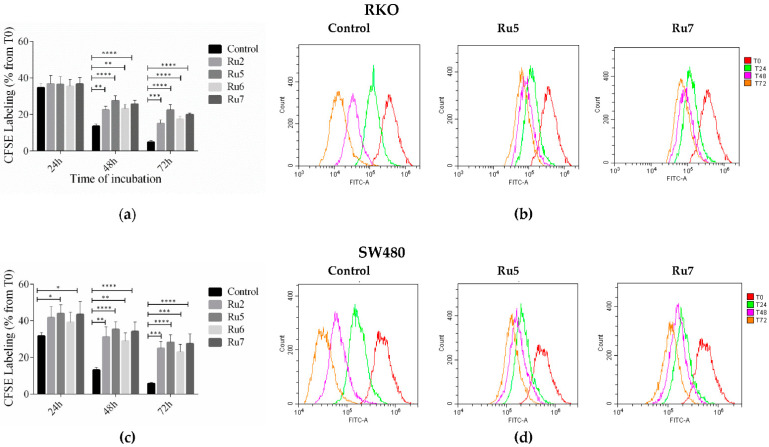
Figure 6.
The effect of ruthenium complexes on cell proliferation assessed by CFSE labeling after 24, 48, and 72 h of incubation with an IC50 concentration in the RKO (a) and SW480 (c) cell lines. A CFSE histogram profile of the RKO (b) and SW480 (d) cells treated with Ru5 and Ru7 for 24, 48, and 72h. Results were statistically different from the negative control for * p < 0.05, ** p < 0.01, *** p < 0.001 and **** p < 0.0001.

