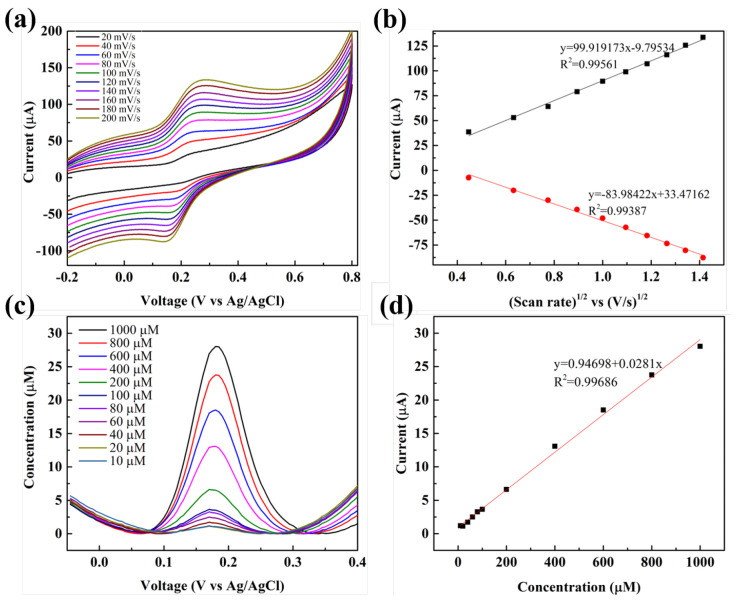
Figure 8.
(a) CV curves obtained at different scan rates (20–200 mV/s) using BT/rGO for oxidation of dopamine (500 µM). (b) Calibration plots featuring the anodic (Ipa) and cathodic peak currents (Ipc) as a function of the square root of the scan rate. (c) DPV current responses for dopamine (10–1000 µM) in PBS (0.1 M, pH 7.03), and the (d) peak current–dopamine concentration plot.

