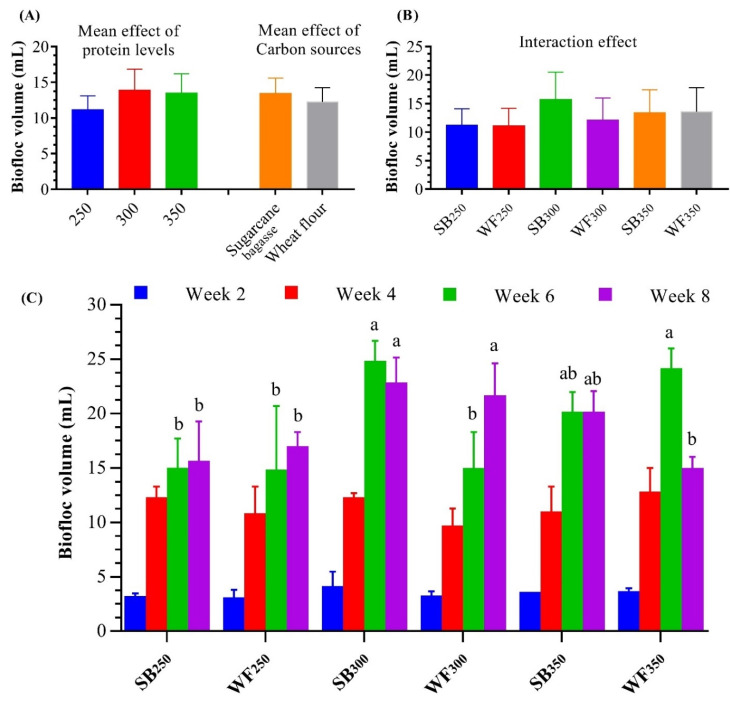
Figure 2.
Effect of dietary protein levels and carbon sources on biofloc volume of whiteleg shrimp, L. vannamei, juveniles reared in water. (A) Mean effects of protein levels and carbon source, (B) interaction effect of protein levels and carbon source, and (C) biweekly in biofloc development. Presented data are means ± SD (n = 3). Different letters in the same week indicate significantly different values (p < 0.05).

