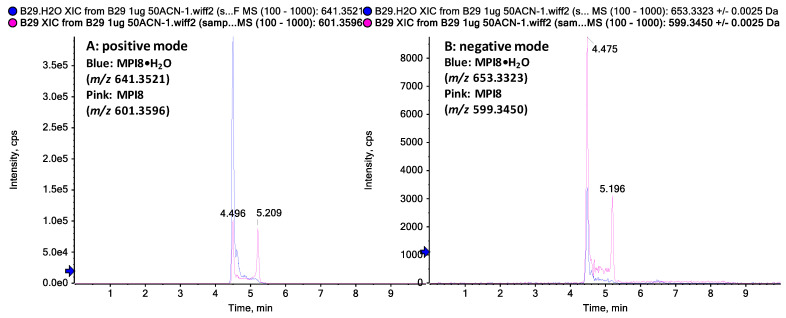
Figure 4.
HR-MS extracted ion chromatograms of MPI8 and MPI8•H2O eluted on a Synergi Fusion-RP column; the peak at 5.2 min was MPI8; the peak at 4.5 min was MPI8•H2O, and the MPI8 signal was due to the in-source fragmentation: (A) MPI8 ([MPI8 + H]+) m/z 601.3596 in pink and MPI8•H2O ([MPI8•H2O + Na]+) m/z 641.3521 in blue in positive mode (B) MPI8 ([MPI8 −H]−) m/z 599.3450 in pink and MPI8•H2O ([MPI8•H2O + Cl]−) m/z 653.3323 in blue in negative mode.

