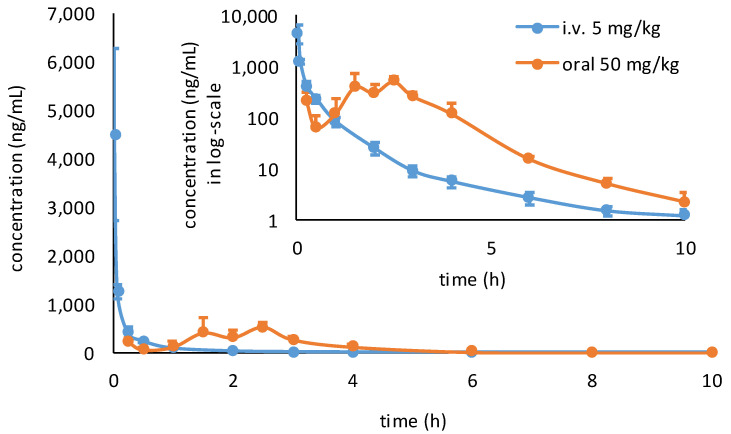
Figure 7.
Mean plasma concentration vs. time profiles of MPI8 in rat plasma after i.v. (n = 3) and oral (n = 3) administration (normal scale plots in normal graph and semi-log plots in inset graph). Twelve time-point plasma samples from rats dosed intravenously and 13 time-point plasma samples from rats dosed orally were collected. Three replicates for each time point were analyzed and reported as mean ± SD for each time-point.

