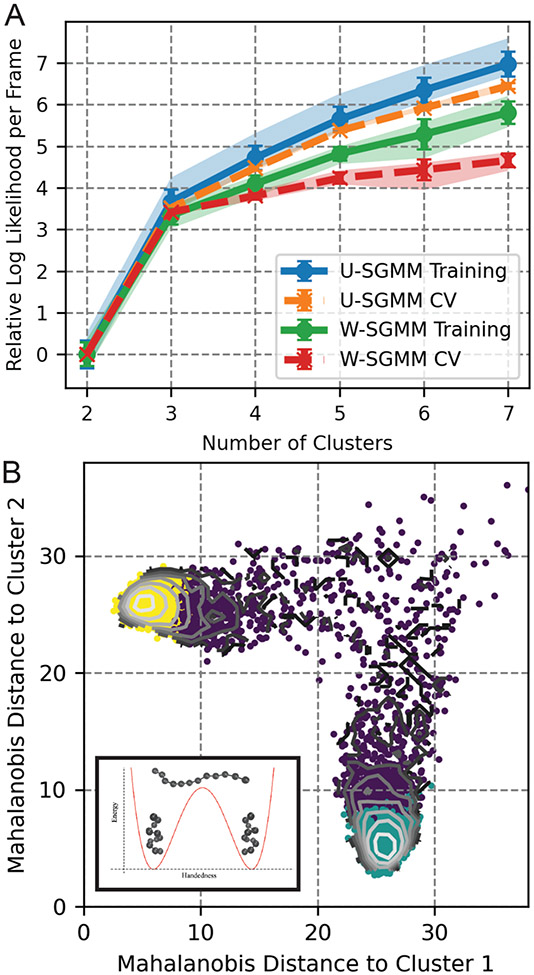
Figure 3:
Clustering of a 12-bead helix transition trajectory. A) The Log likelihood as a function of number of clusters for uniform shape-GMM and weighted-shape-GMM. Error bars denote standard deviation and shaded regions denote the 90% confidence interval obtained from clustering using five different training sets. B) Clustering results for 3 clusters from W-SGMM on 2D free energy surface of weighted Mahalanobis distance from two cluster centers (inset: schematic of potential energy diagram).

