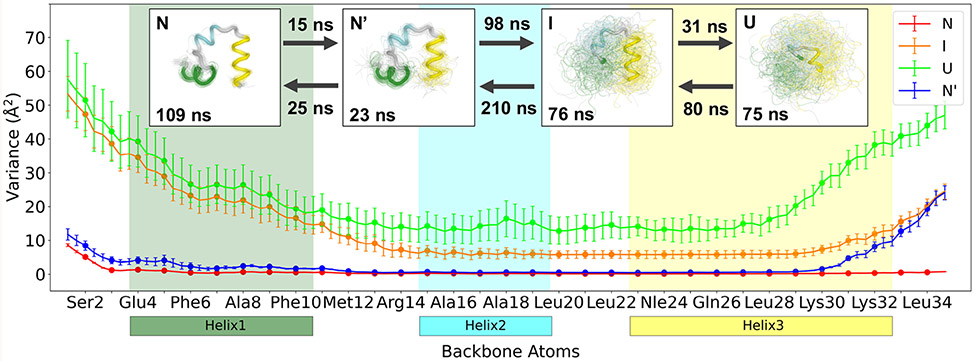
Figure 6:
Weighted 4-state shape-GMM results for HP35. Variation in backbone atomic displacement of each state. Regions corresponding to helix 1, helix 2 and helix 3 are colored forest green, cyan, and yellow, respectively. Error bars represent standard deviation of the values estimated from dividing the trajectory into 10 equal sized continuous segments. Enlarged points represent the Cα atoms of each residue. Top: GMM centers in thick tube representation with 100 random frames from each cluster in thin tube representation. State lifetimes are shown in each structural figure, with MFPTs between connected states.

