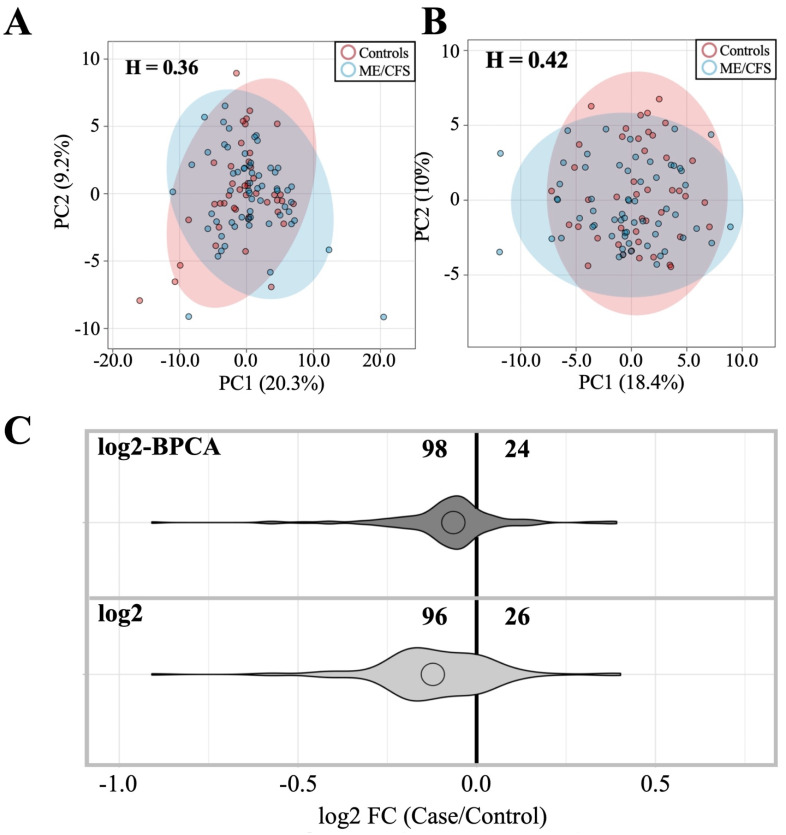
Figure 1.
Comparison of ME/CFS and control antibody profiles with and without outlier replacement. (A) PCA of ME/CFS vs. control subjects using log2 dataset. (B) PCA of ME/CFS vs. control using log2 BPCA-estimated outlier replacement dataset. H = Hopkins statistic. PCA legend indicates patients (blue) vs. controls (red). (C) Violin plot depicting fold-change relationship between case and control subjects within each dataset.

