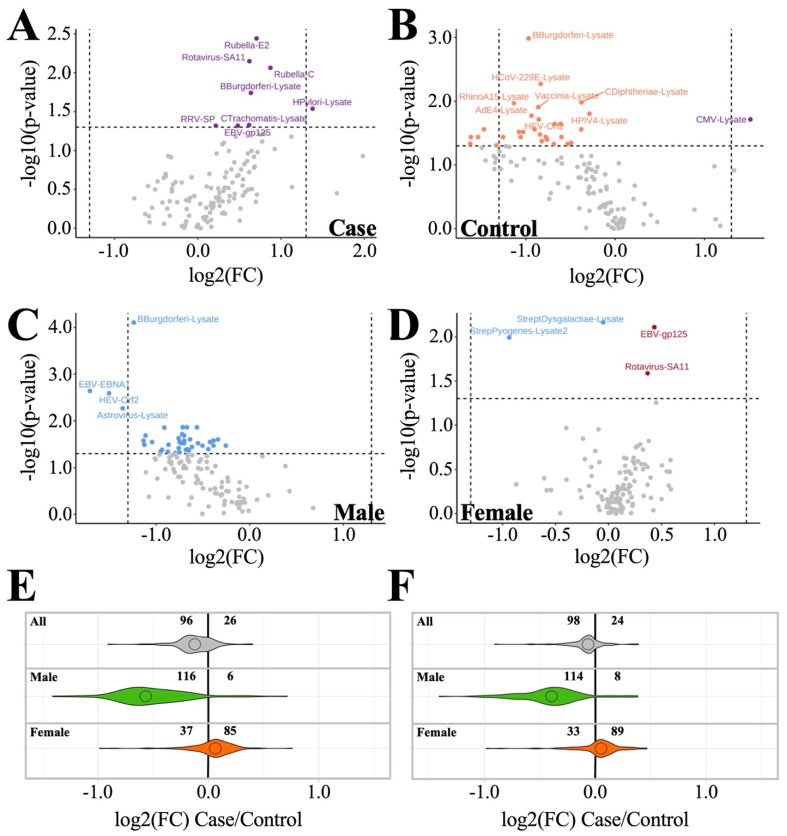
Figure 3.
Inter- and intra-cohort sex-specific antibody profile trends. (A,B) Intra-cohort comparisons (female/male). (A) ME/CFS male vs. ME/CFS female. (B) Control male vs. control female. (C,D) Inter-cohort comparisons (case/control). (C) ME/CFS male vs. control male. (D) ME/CFS female vs. control female. (Purple) antigens with average antibody levels higher in females. (Orange) antigens with average antibody levels higher in males. (Blue) antigens with average antibody levels lower in cases than controls. (Red) antigens with average antibody levels lower in controls than in cases. Horizontal line in volcano plot indicates p = 0.05. (E,F) Violin plots depicting fold change. All, male, and female subgroup antigen fold changes between case and control are shown. Less than zero indicates lower in case vs. control. (E) Log2 dataset without outlier replacement; (F) log2 dataset with BPCA-estimated outlier replacement.

