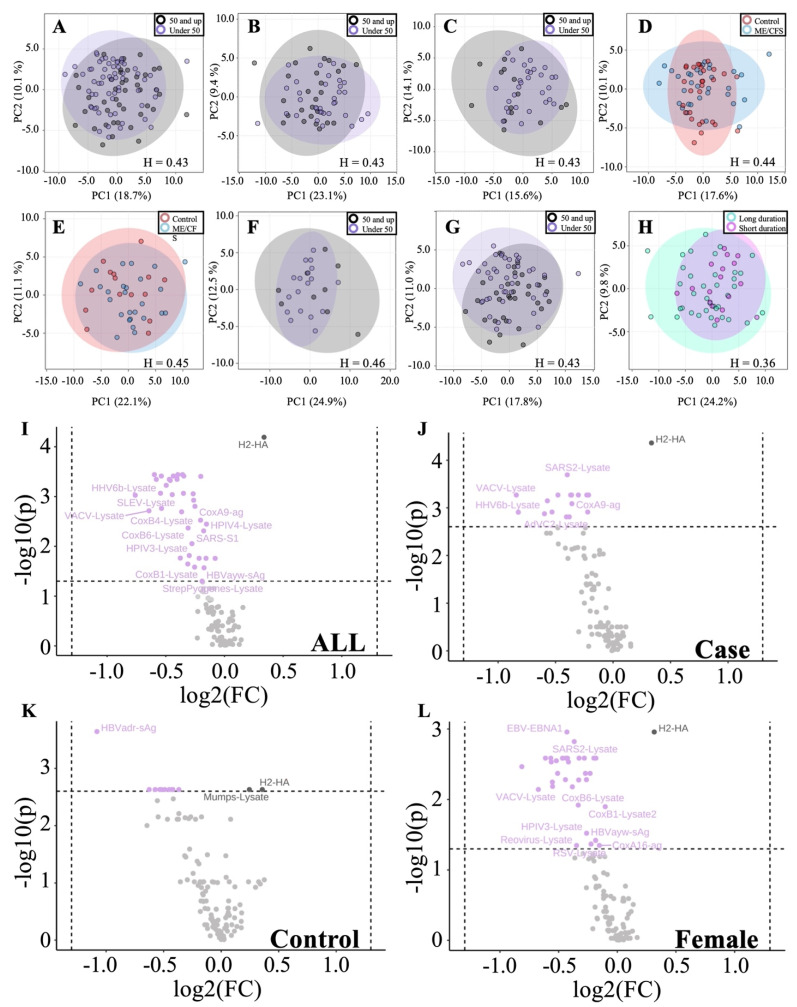
Figure 4.
Age- and illness-duration-based antibody profile comparisons. (A) All subjects under 50 vs. all subjects 50 and up. (B) ME/CFS under 50 vs. ME/CFS 50 and up. (C) Control under 50 vs. control over 50. (D) ME/CFS vs. control under 50. (E) ME/CFS vs. control over 50. (F) Male under 50 vs. male over 50. (G) Female under 50 vs. female over 50. (H) ME/CFS short (≤5 years) vs. long (>5 years) illness duration. H = Hopkins statistic. Hopkins statistic is individually given for each PCA. (Black) 50 and up. (Purple) under 50. (Red) control. (Blue) ME/CFS. (Turquoise) long duration. (Fuchsia) short duration. (I–L) Volcano plot highlighting antigens with significantly different levels between age groups overall and within experimental subgroups (Over 50/Under 50). (I) All subjects under 50 vs. all subjects over 50. (J) ME/CFS under 50 vs. ME/CFS over 50. (K) Control under 50 vs. control over 50. (L) Female under 50 vs. female over 50. (Light purple) antigen level is lower in the over 50 age group. (Black) antigens higher in the over 50 age group.

