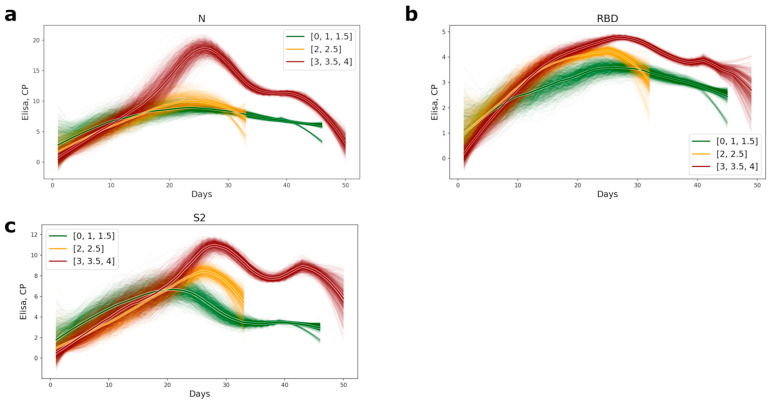
Figure 1.
Plots of appearance of the antibodies to the conformational epitopes of N (a), RBD (b), and S2 (c) proteins in COVID-19 patients’ serum. The lines were computed as subsampled sliding windows with a window width of 0 and a subsampling size of 7. The bolder lines are the averages of approximations. The color of the lines represents the level of disease severity: the green lines, the mild course of disease (CT = 0–1.5); the yellow, the medium level of disease (CT = 2–2.5), and red, the most severe (CT = 3–4).

