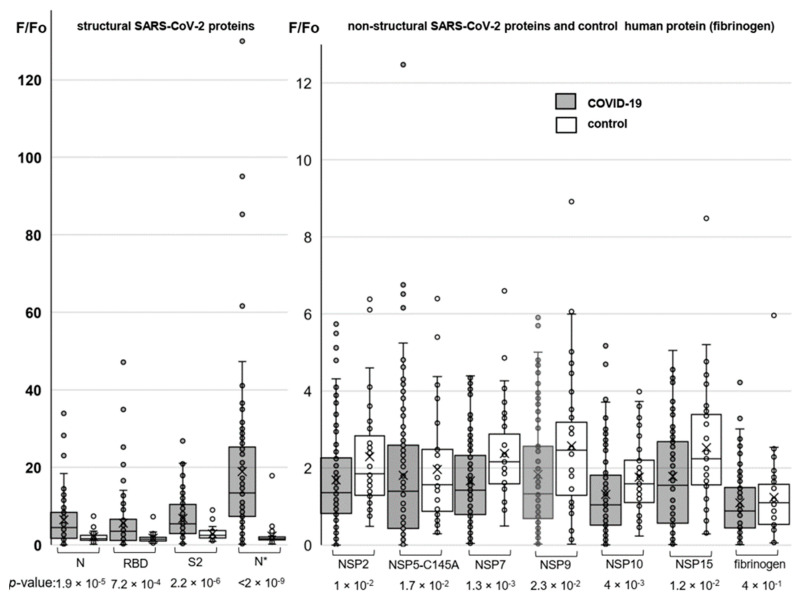
Figure 3.
Profiling responses to the structural (left) and non-structural (right) SARS-CoV-2 proteins using protein microarrays. The box plots summarize the distributions of the relative levels of antibodies to particular proteins detected in COVID-19-positive donors (numbers of samples: 95 for SARS-CoV-2 proteins and 80 for fibrinogen) and the control group (numbers of samples: 37 for SARS-CoV-2 proteins and 34 for fibrinogen).

