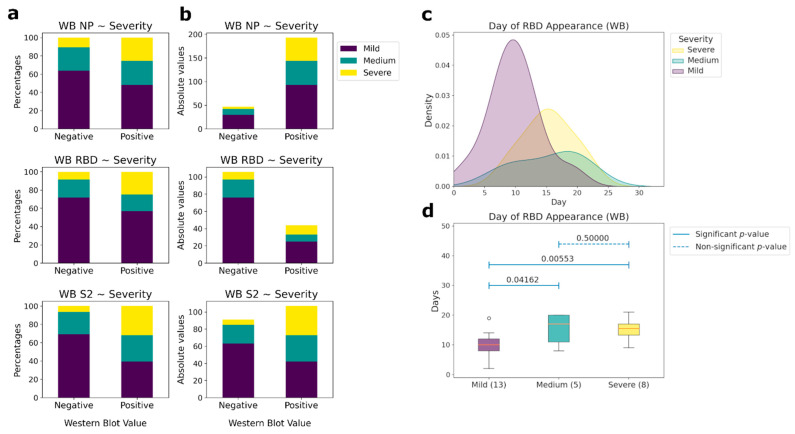
Figure 4.
Correlations between the presence of IgG antibodies to linear epitopes NP, RBD, and S2 and patient’s condition severity (western blot (WB) data). (a) Comparative analysis between the presence (positive) or absence (negative) of antibodies and the severity of patient condition according to CT in percentages. (b) Comparative analysis between the presence (positive) or absence (negative) of antibodies and the severity of the patient’s condition according to CT in absolute values. (c) Histograms of the day of appearance of antibodies for those samples, for which the day of the beginning of the disease is known, to the linear (western blot) epitopes of RBD, depending on the severity of patient condition. (d) Comparative analysis of the day of the antibodies presence to the linear epitopes of the RBD protein and the severity of the patient condition for those samples, for which the day of the beginning of the disease is known. The number of patients in each severity group, for which the linear epitopes were measured, is outlined in brackets. Pairwise comparisons were performed using the Mann-Whitney test. p-values of the corresponding comparisons are presented above the blue segments. Solid segments correspond to the significant p-values (≤0.05), dashed segments represent non-significant p-values (>0.05).

