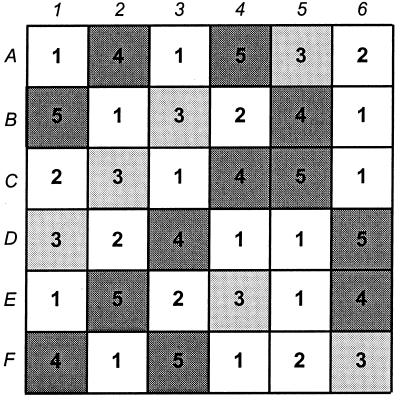
FIG. 1.
Arrangement of plots during 1998 field experiment. Each square represents a separate plot. Plots were assigned to one of five treatments by following a randomized Latin square arrangement. The squares shaded light gray indicate the plots containing plants inoculated with CP6RS, squares shaded dark gray indicate the plots containing plants inoculated with CP6RS-ly-Φ1, and unshaded squares represent plots containing uninoculated plants, either by design (i.e., treatment 1), or through inoculation failure (i.e., treatment 2); see the text for descriptions of treatments.

