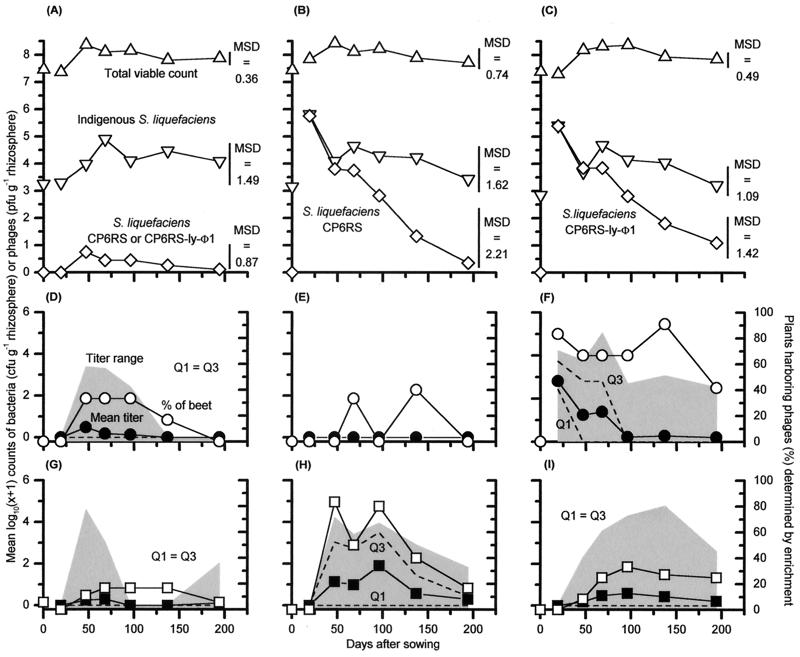
FIG. 3.
1998 field experiment, showing the fate of the S. liquefaciens CP6RS and CP6RS-ly-Φ1 releases within the sugar beet rhizospheres and the consequent phage blooms they triggered. Bacterial counts (A to C) are compared with those of phage ΦCP6-1 (D to F) and phage ΦCP6-4 (G to I). Due to the nonsurvival of S. liquefaciens CP6SpN in situ, a comparison is made between uninoculated beets (a pooling of results from treatments 1 and 2) (A, D, and G), nonlysogen-treated beets (treatment 3) (B, E, and H), and lysogen-treated beets (pooled results from treatments 4 and 5) (C, F, and I). Because of this pooling of results, each plotted point represents either 18 plants (uninoculated beets), 6 plants (nonlysogen-treated beets), or 12 plants (lysogen-treated beets). See the text for an explanation of why the treatments were combined. Means of the phage titers are indicated by solid symbols. The gray shading indicates the range of the phage titers, whereas the dashed lines show the positions of both the upper (Q3) and lower (Q1) quartiles of this data. Also shown (D to I) are phage abundances detected after nutrient enrichment (open symbols).

