
Figure 1.
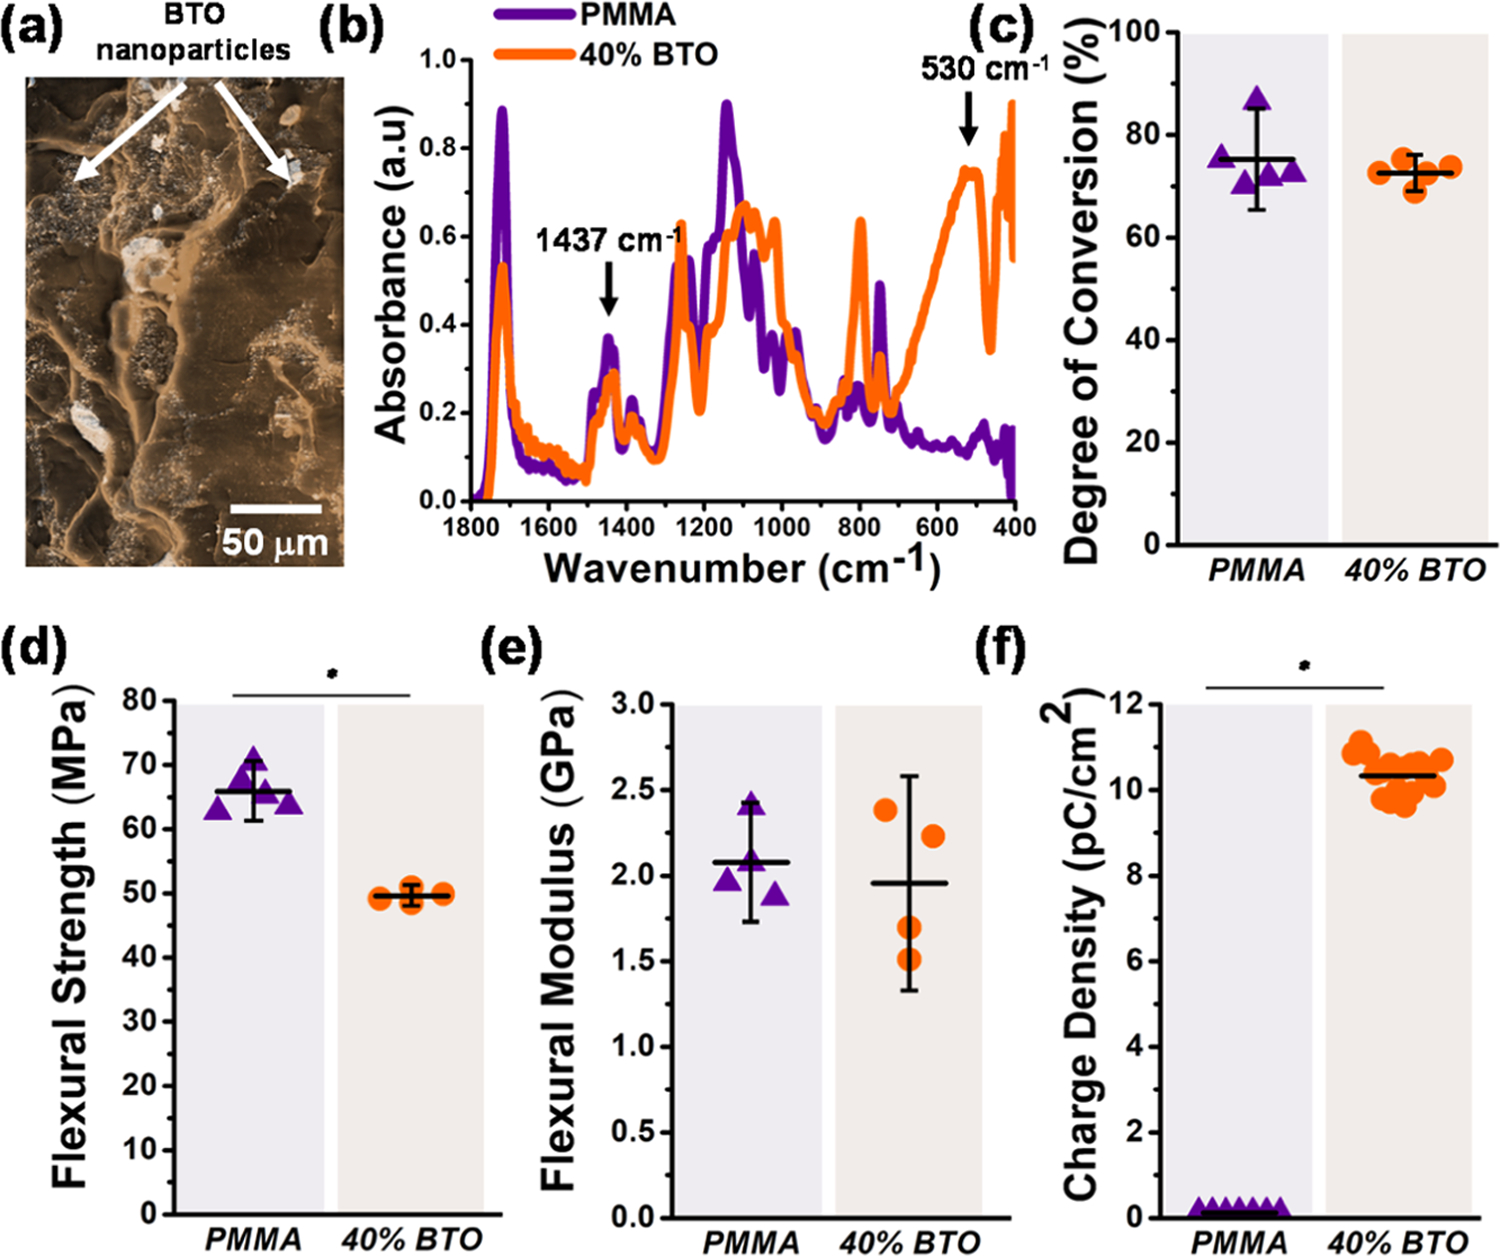
Characterization of PMMA piezoelectric composites. (a) Micrograph of the fracture surface of a PMMA sample filled with 40% of BT. White arrows indicate piezoelectric fillers. (b) Selected FTIR spectra of the fracture surface of the commercial PMMA and the piezoelectric composite, indicating the characteristics peaks corresponding to the PMMA matrix (1437 cm−1) and BT filler (530 cm−1). (c) Degree of conversion of the commercial PMMA and the piezoelectric composites measured by Fourier transform infrared (FTIR) spectroscopy (p = 0.4204). (d) Flexural strength (p = 0.000) and (e) flexural modulus of the piezoelectric composites and the commercial PMMA (p = 0.8055). (f) Electrical charge density (Q per cm2) generated by PMMA piezoelectric composites subjected to a three-point bending cyclic loading of 5 N at 2 Hz (p = 0.000). For all tests, the error bars were obtained from N = 5 samples. Significant differences between the groups are expressed as *p < 0.05.