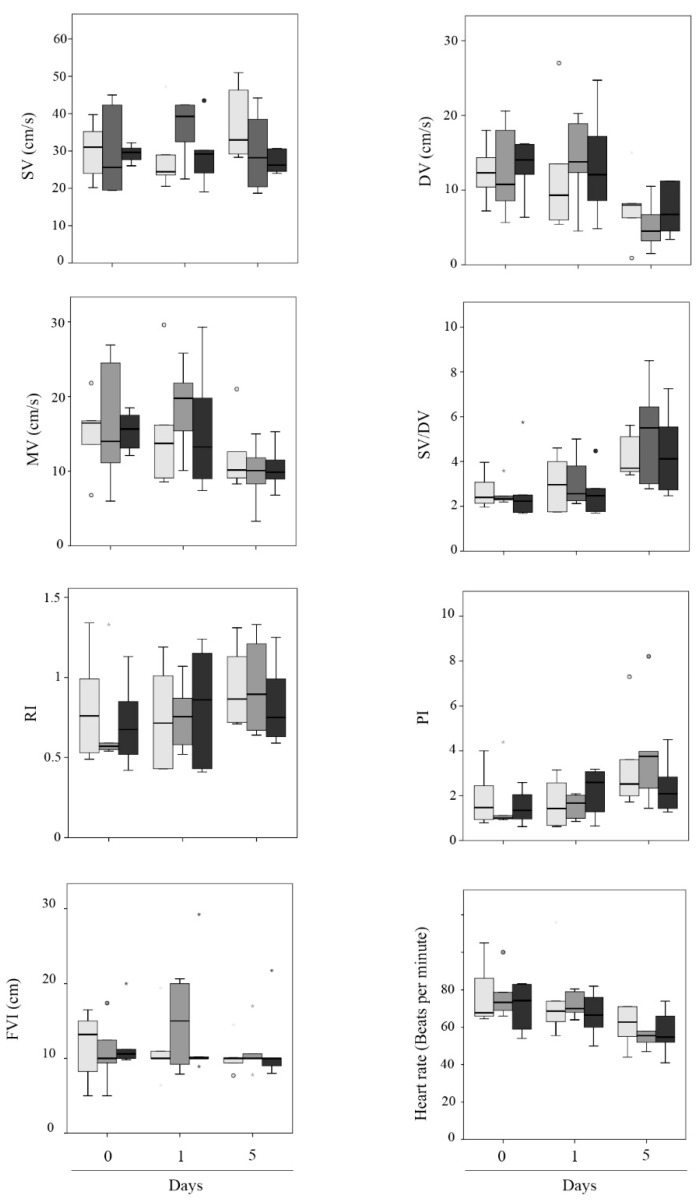
Figure 4.
Box plot describing Doppler ultrasonography values of the uterine arteries’ blood flow at the three days of evaluation (D0, D1, and D5) analyzed by the type of seminal dose used (F1—light grey bars, F2—grey bars, and F3—dark grey bars). The statistical comparison was performed between seminal dose types (F1-F2-F3) on each day of analysis (D0, D1, and D5). No significant differences were observed (p > 0.05). Small circles (°) and asterisks (*) in the box plot represent outliers and extreme cases, respectively.

