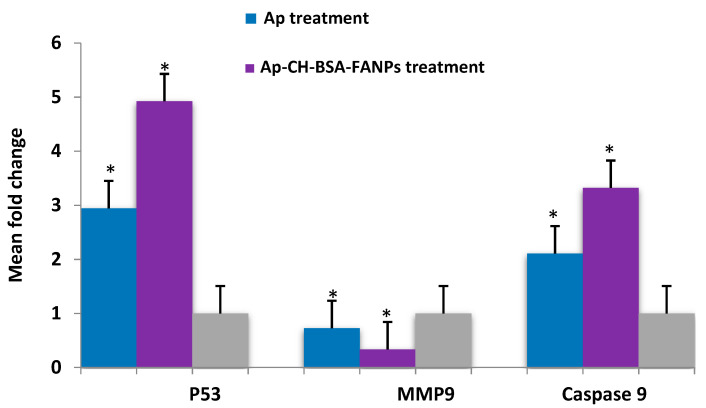
Figure 11.
Bar plots presentation of RT-PCR analysis of the mean fold change of the p53, MMP9, and caspase 9 gene expression in HePG-2 cells treated with IC50 of Ap or Ap-CH-BSA-FANPs compared with the untreated cells. β-actin was used as a standard gene. * p < 0.05 significant compared to untreated HePG-2 cells.

