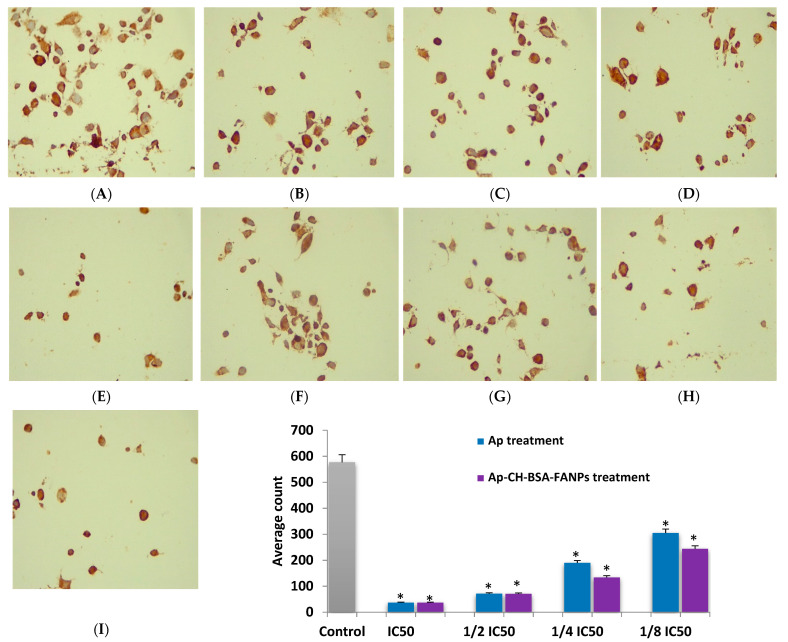
Figure 12.
Immunohistochemical examination of Bcl-2 gene in HePG-2 cells treated with 1/8, 1/4, 1/2, and IC50 values of the Ap (B–E) or Ap-CH-BSA-FANPs (F–I) compared with the untreated cells (A). Bar plot indicates the average count of the Bcl-2 after treatment with Ap or Ap-CH-BSA-FANPs. * p < 0.05 significant compared with the untreated HePG-2 cells. (A). Untreated HePG-2. (B). HePG-2 treated with the 1/8 IC50 of Ap-CH-BSA-FANPs. (C). HePG-2 treated with the 1/4 IC50 of Ap-CH-BSA-FANPs. (D). HePG-2 treated with the 1/2 IC50 of Ap-CH-BSA-FANPs. (E). HePG-2 treated with the IC50 of Ap-CH-BSA-FANPs. (F). HePG-2 treated with the 1/8 IC50 of Ap. (G). HePG-2 treated with the 1/4 IC50 of Ap. (H). HePG-2 treated with the 1/2 IC50 of Ap. (I). HePG-2 treated with the IC50 of Ap.

