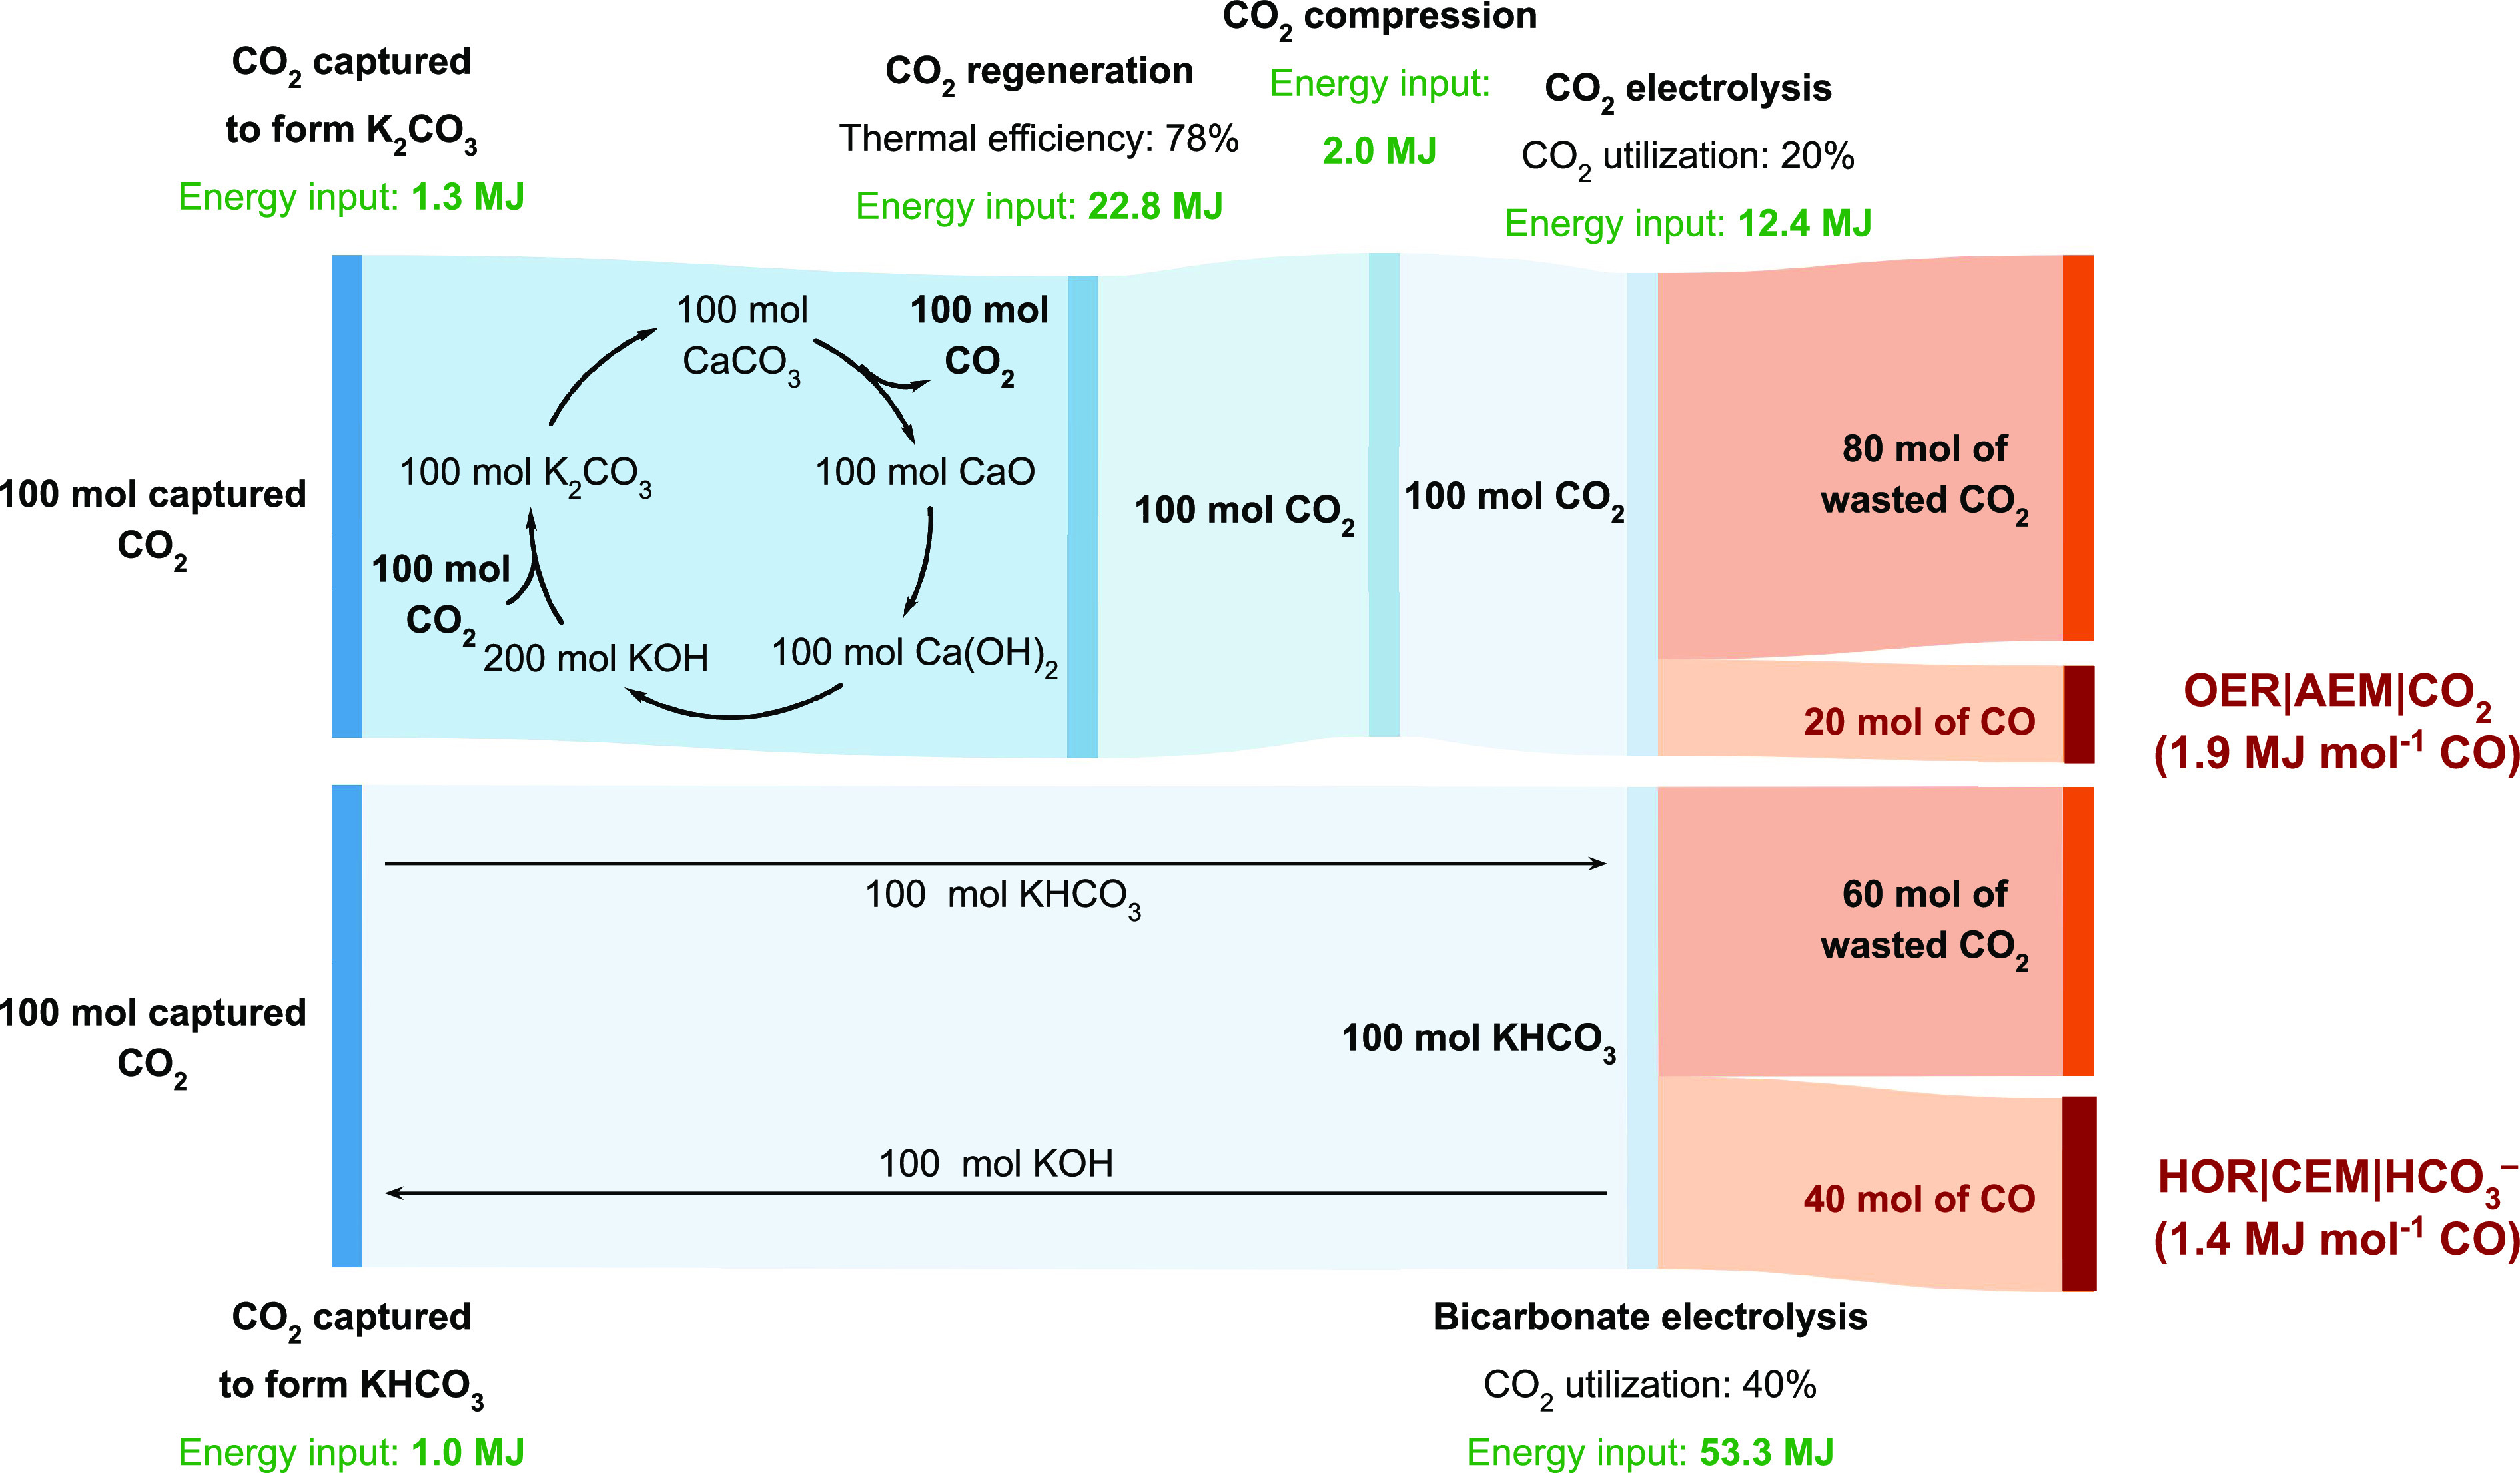
Figure 3.

Sankey diagrams illustrating CO2 mass flows and energy inputs for the capture and conversion of atmospheric CO2 into CO using an anion exchange membrane (AEM) electrolyzer. The top panel assumes that captured CO2 is regenerated using a direct air capture process30,42 and that the electrolyzer is fed with a compressed CO2 feed (Faradaic efficiency for CO production, FECO = 90%; Vcell = 3.0 V; CO2 utilization efficiency 20%; J = 500 mA cm–2). The bottom panel relies on the electrolysis of KHCO3 and bypasses the CO2 regeneration and compression steps (FECO = 50%; Vcell = 2.5 V; CO2 utilization efficiency 40%; J = 500 mA cm–2). Energy inputs are sourced from refs (30 and 42). The bicarbonate electrolysis pathway analysis accounts for the energy required to generate H2 from a water electrolyzer (347 kJ mol–1 H2).43 Details are provided in Table S1.
