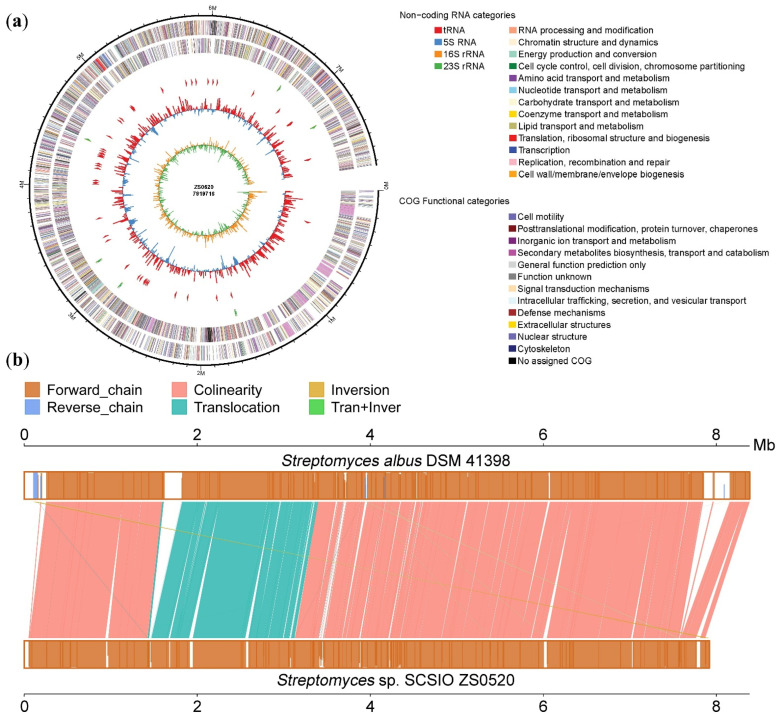
Figure 2.
(a) The complete genomic graph of Streptomyces sp. SCSIO ZS0520. The six circles (from outer to inner) represent the size of the genome, CDs on positive chains, CDs on negative chains (different colors represent the functional classification of cogs with different CDs), rRNA and tRNA, GC content, and GC skew value; (b) the comparative genomics graph between Streptomyces sp. SCSIO ZS0520 and Streptomyces albus DSM 41398.

