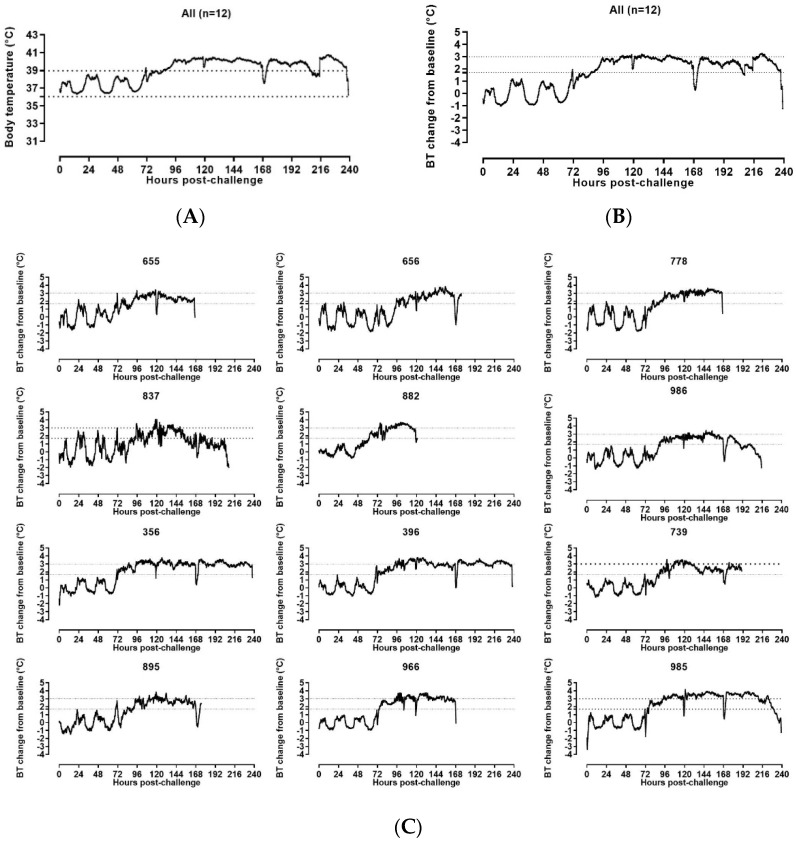
Figure 5.
Star Oddi-based body temperature changes in SUDV-challenged animals. (A) Group mean StarOddi telemetry-based Body Temperature (BT) versus time. The straight dashed lines indicate the baseline minimum and maximum BT values. (B) Group mean StarOddi telemetry-based BT change from baseline versus time. (C) Star Oddi telemetry-based BT change from baseline in individual SUDV challenged animals versus time. (B,C): The straight dashed lines indicate the BT change from baseline corresponding to fever (≥1.7 °C) and hyperpyrexia (≥3 °C)).

