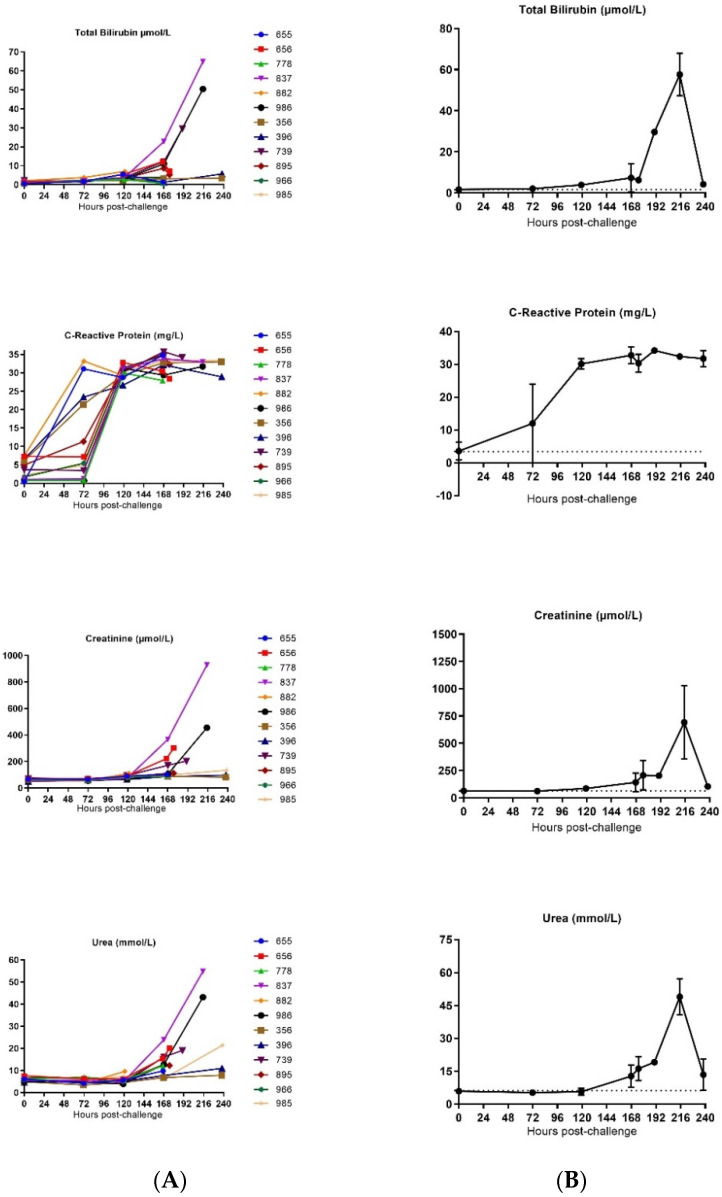
Figure 7.
Biochemical analysis in SUDV-challenged animals. (A) Individual biochemical parameter evolution versus time. (B) Group mean biochemical parameter evolution versus time. Average measurements taken before exposure serve as baseline (represented by horizontal straight dashes lines). Error bars represent the standard deviation (SD) of the mean.


