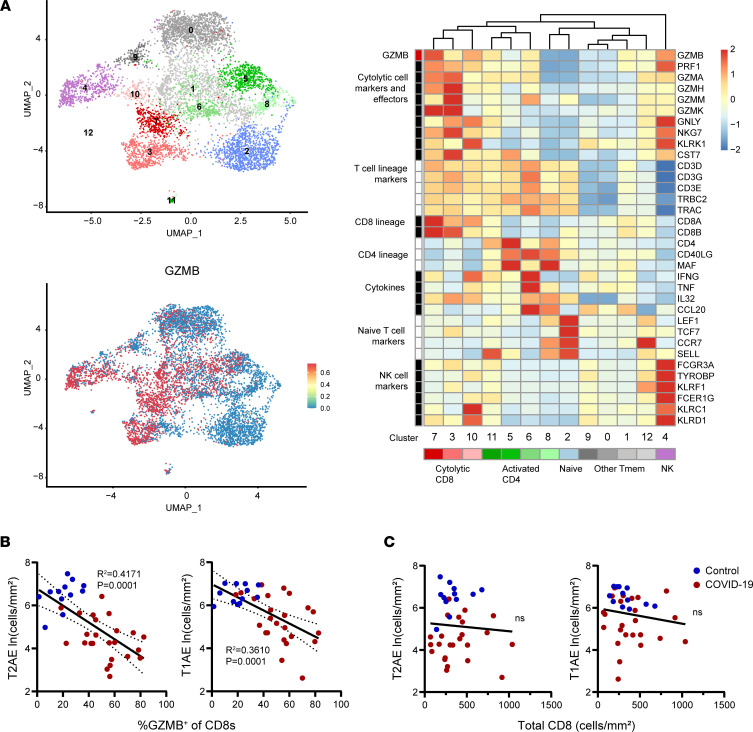
Figure 6. Correlation of lung T cell cytotoxicity with alveolar epithelial cell loss in fatal COVID-19.
(A) Uniform manifold approximation and projection (UMAP) embeddings of total T/NK cells obtained from airways of 3 patients with COVID-19 (top left) with a feature plot showing normalized expression of GZMB (bottom left). Representative marker genes for each cluster are shown in the normalized and scaled heatmap to the right, with color bars corresponding to position on the UMAP. (B) The percentage GZMB+ cells within the CD8+ T cell subset in lungs and (C) the overall density of all CD8+ T cells is plotted against the density of lung T2AE cells (left) and T1AE cells (right) from all COVID-19 cases (n = 24) and controls (n = 12). The best-fit line with 95% confidence bands and R2 and P values were calculated using simple linear regression analysis.

