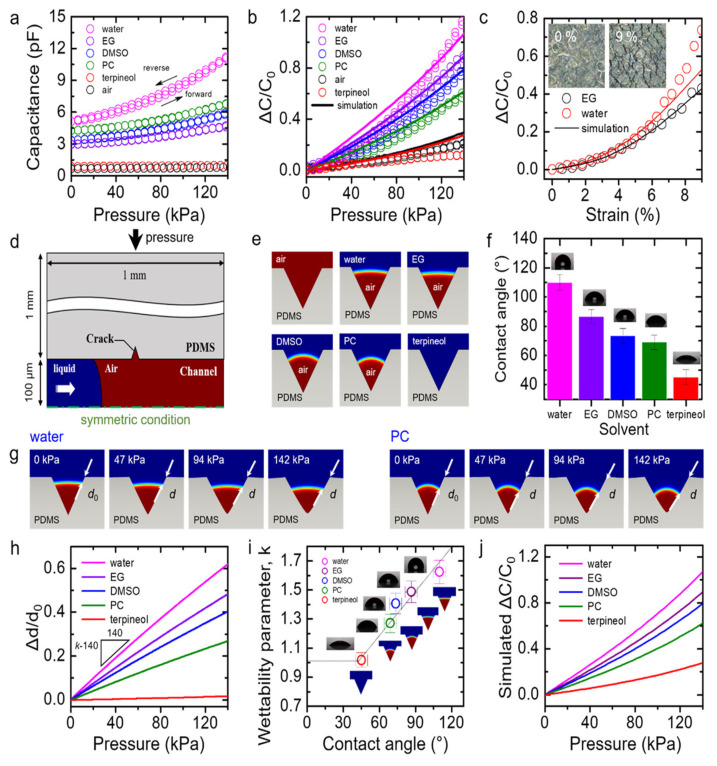
Figure 3.
(a) An analysis of the capacitance at 0–140 kPa as a function of applied pressure for crack-enhanced microfluidic pressure sensors prepared with five sensing liquids. (b) Normalized capacitance plotted as a function of all sensors. The values simulated are represented by solid lines. (c) Normalized capacitance of EG or water-based sensors as a function of train, ranging from 0% to 9%. (d) The channel and crack simulated in the COMSOL are depicted schematically in this diagram. (e) In each liquid example, COMSOL modeling results were achieved under the initial conditions, simulating the interface in the crack after filling the channel. (f) Angles of contact between liquids and the PDMS surface. (g) COMSOL modeling results produced by COMSOL for the water and PC under various pressure settings. (h) Simulated Δd/d0 vs. the applied pressure corresponding to each. (i) Wettability parameters (k) plotted as function of contact angle. (j) Illustration of the simulated normalized capacitance as function of the pressure [83]. Copyright 2017, American Chemical Society.

