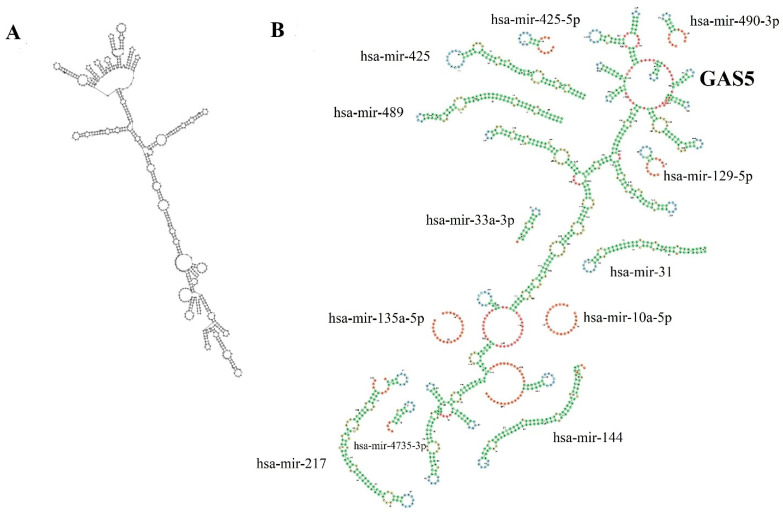
Figure 2.
Diagram representation of (A) The minimum free energy (MFE) secondary structure of GAS5 predicted using RNA-fold web server (http://rna.tbi.univie.ac.at/cgi-bin/RNAWebSuite/RNAfold.cgi) (accessed on 24 March 2022). (B) The secondary structure of GAS5 regions sponging miRNAs in GAS5 variant 1 is shown using forna (force directed graph layout) [28].

