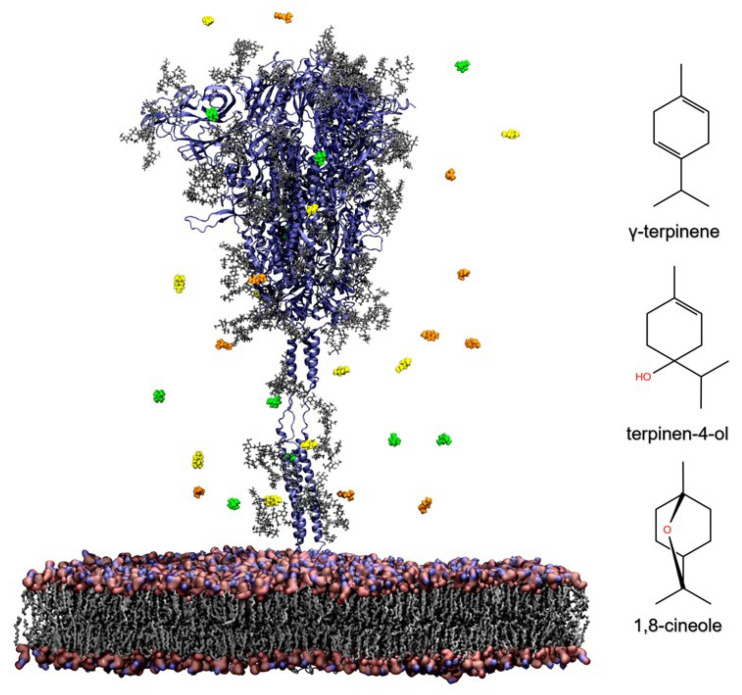
Figure 1.
Overview of the simulation system. The S glycoprotein is shown as blue cartoon and the glycans as grey sticks. Membrane polar heads are shown as surface, colored by atom types, while lipid tails are represented as grey sticks. TTO compounds are shown as spheres, with γ-terpinene molecules in orange, terpinen-4-ol in yellow, and 1,8-cineole in green, and their molecular structure is represented in 2D on the right.

