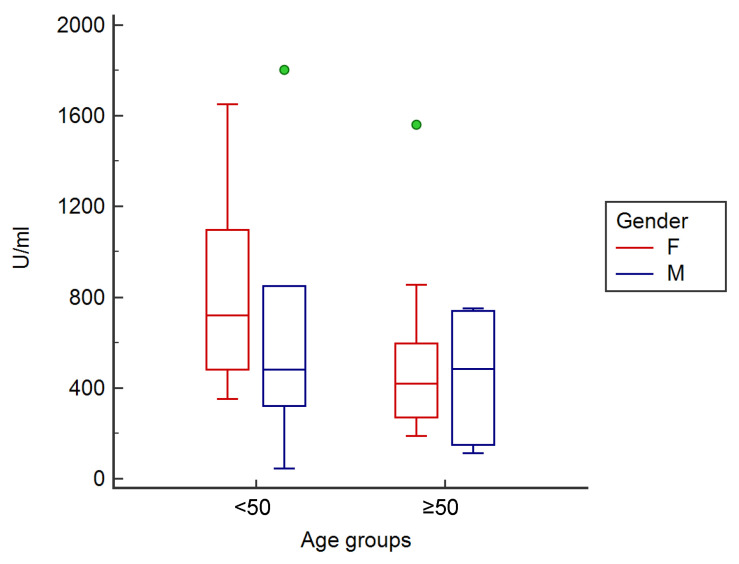
Figure 3.
Clustered multiple comparison graph showing the minimum, maximum, median, and outliers (green circles), as well as the distribution of antibody concentration as an interquartile range (each segment or rectangle) in analyzed subjects according to gender and age group before the third dose of vaccine.

