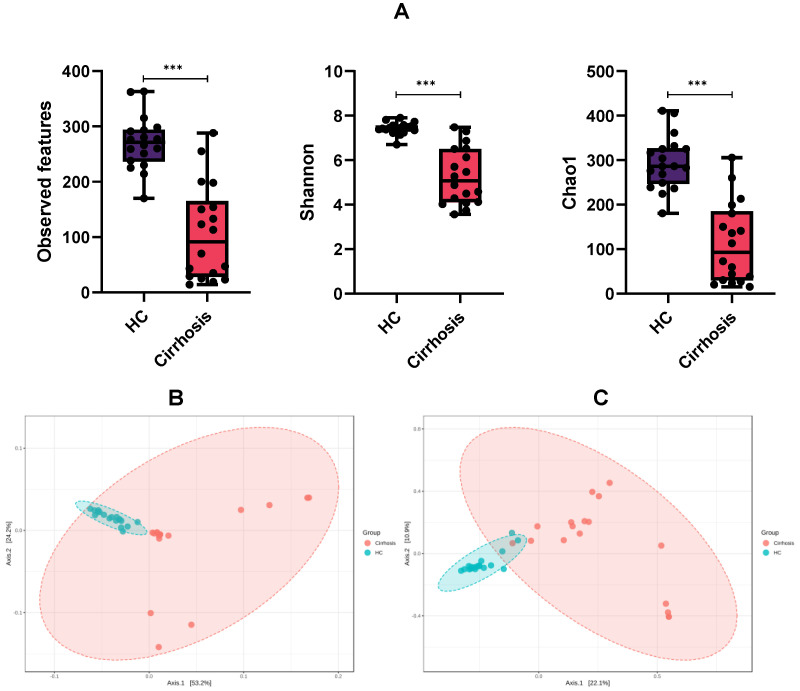
Figure 1.
Microbiota richness and diversity. (A) Alpha diversity indices: Observed features, Shannon and Chao1 indices of healthy controls group compared with patients with cirrhosis. Mann-Whitney U test, *** p < 0.001; (B) Beta diversity plots for weighted and unweighted (C) UniFrac distances in cirrhosis group (red) and healthy control group (HC, blue). PERMANOVA tested, p < 0.001 in both cases.

