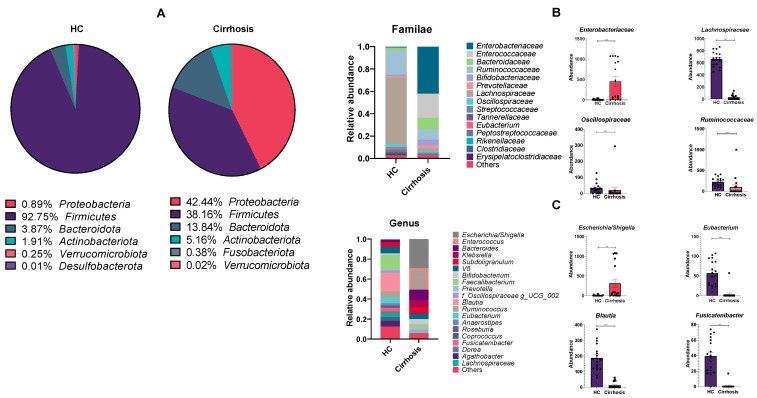
Figure 2.
Relative abundance plots of healthy controls group (HC) and patients with cirrhosis group. (A) Pie chart representing different phyla in both groups. Phyla are accompanied by relative abundance value (%); (B) Stacked bar plot of bacterial familiae in HC group and cirrhosis group (A); on the right, increased abundance of Enterobacteriaceae in cirrhosis group are observed, while increased abundance of Lachnospiraceae, Oscillospiraceae and Ruminococcaceae are characteristic of HC group. Below (C), stacked bar plot of bacterial genera in HC group and cirrhosis group; in concordance with previous plot, on the right increased abundance of Escherichia/Shigella is characteristic of cirrhosis group, whereas Eubacterium, Blautia and Fusicatenibacter abundance exhibit a significantly increased abundance in HC group. Mann-Whitney U test, ** p < 0.01, *** p < 0.001.

