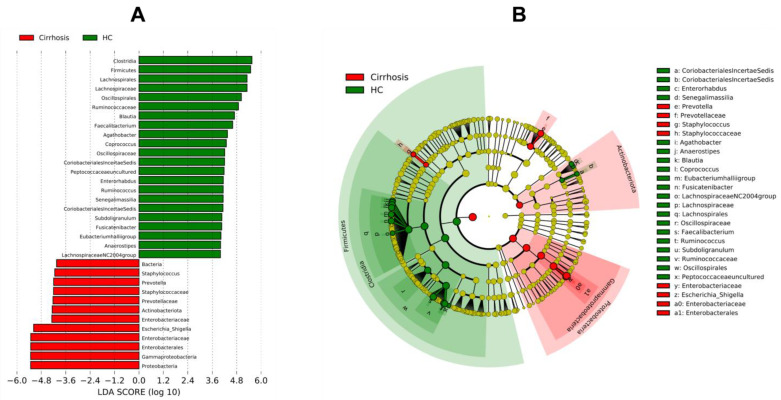
Figure 3.
LEfSe analysis identifying key taxa in intestinal microbiota from patients with cirrhosis versus healthy control group (HC). (A) Bar plot showing LDA scores (Log > 4; p < 0.05); (B) Cladogram showing differentially abundant taxa at phylum, class, family, and genus levels between the two groups. Red circles indicate the remarkable taxa in the cirrhosis group while the green designates the HC group.

