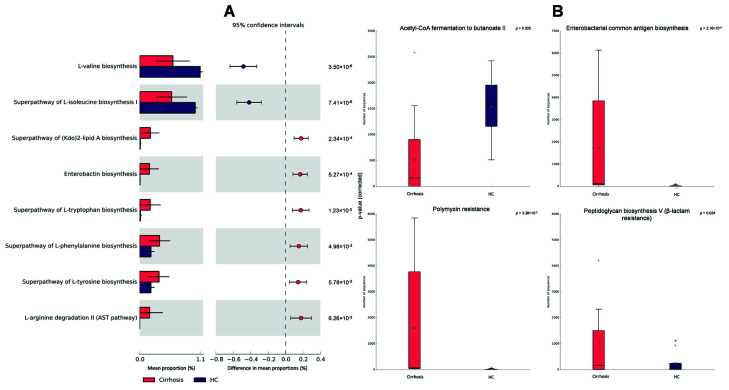
Figure 4.
PICRUSt2 functional prediction of the patients with cirrhosis (red) compared with healthy controls (HC, purple). (A) Comparisons among MetaCyc pathways shown by mean proportion and difference in mean proportions; (B) Most relevant pathways are shown individually. The analysis was done with Welch’s inverted method, p-values were filtered with a cut-off value of p < 0.05.

