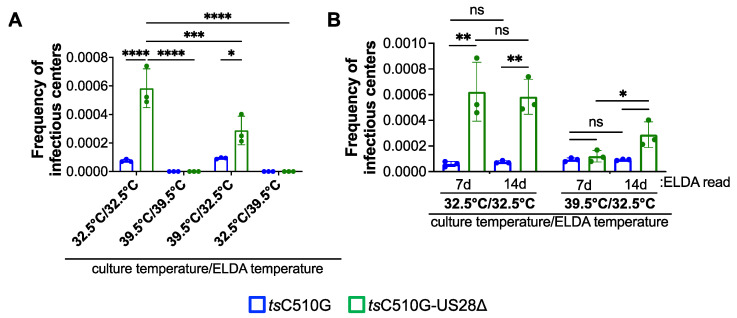
Figure 4.
tsC510G-US28∆-infected Kasumi-3 cells display a decrease in the frequency of infectious centers at the non-permissive temperature. Kasumi-3 cells were infected (moi = 1.0 TCID50/cell) with tsC510G or tsC510G-US28∆ and maintained in conditions favoring latency at the indicated culture temperature (7 d). Each infected population was then co-cultured with naïve NuFF-1 cells (14 d) at the indicated temperature (ELDA temperature). (A) The frequency of infectious centers was calculated by ELDA 14 d post-co-culture. (B) The infected cells cultured at 32.5 °C and 39.5 °C that were shifted to 32.5 °C were quantified by ELDA at 7 d post-co-culture. Note that the 14 d data are replotted in this graph and identical to the data shown in (A). (A,B) Each data point (circles) is the mean of three technical replicates. Error bars indicate SD of three biological replicates. The statistical significance was calculated using two-way ANOVA followed by Tukey’s post hoc analysis. * p < 0.05, ** p < 0.01, *** p = 0.0005, **** p < 0.0001.

