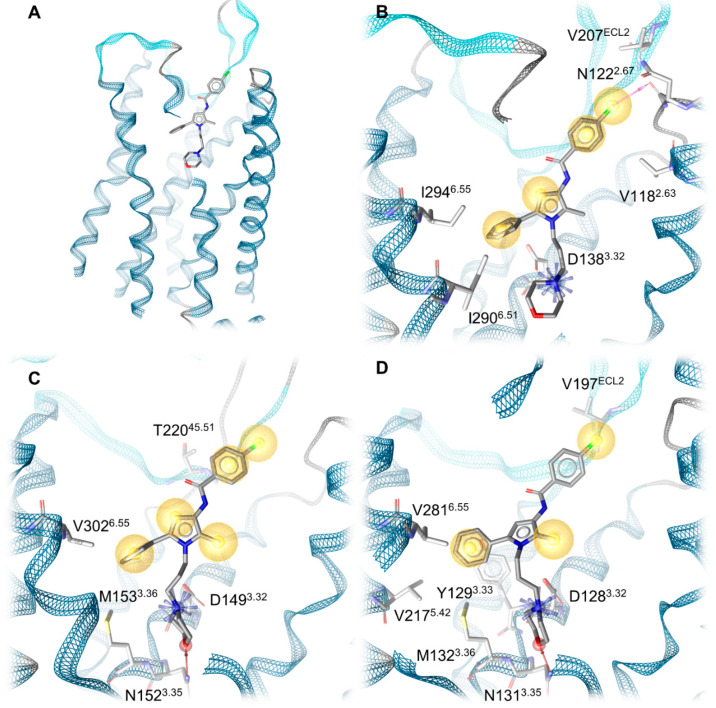
Figure 6.
Protein–ligand interactions. (A) Global view of Compound A bound to the KOR. (B) Protein–ligand interactions at the KOR. (C) Protein–ligand interactions at the MOR. (D) Protein–ligand interactions at the DOR. Blue stars indicate positive charges, yellow spheres lipophilic contacts, pink arrows halogen bond donors and red arrows hydrogen bond acceptors. The residues 313–319 in the KOR, 314–327 in the MOR and 276–279 as well as 296–307 in the DOR are not shown for better visualization.

