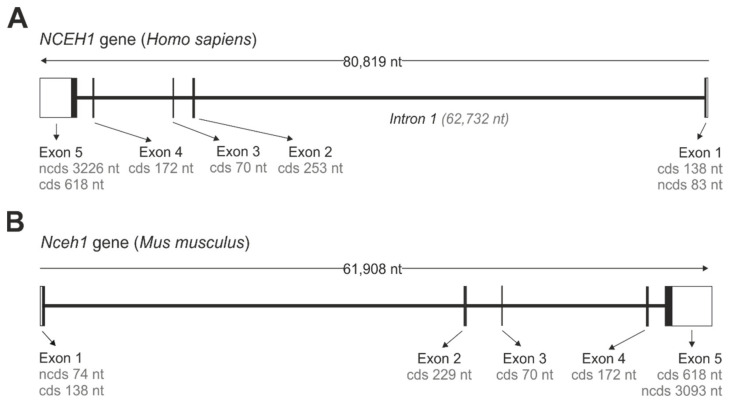
Figure 1.
Gene organization of NCEH1/Nceh1. Gene organization of the human NCEH1 (A) and murine Nceh1 (B). Open boxes (white) represent non-coding 5′ and 3′ nucleotide sequences (ncds). Closed boxes (black) represent exons that are separated by intron stretches, represented by interconnecting lines. Lengths of non-coding and coding sequences (cds) are indicated.

