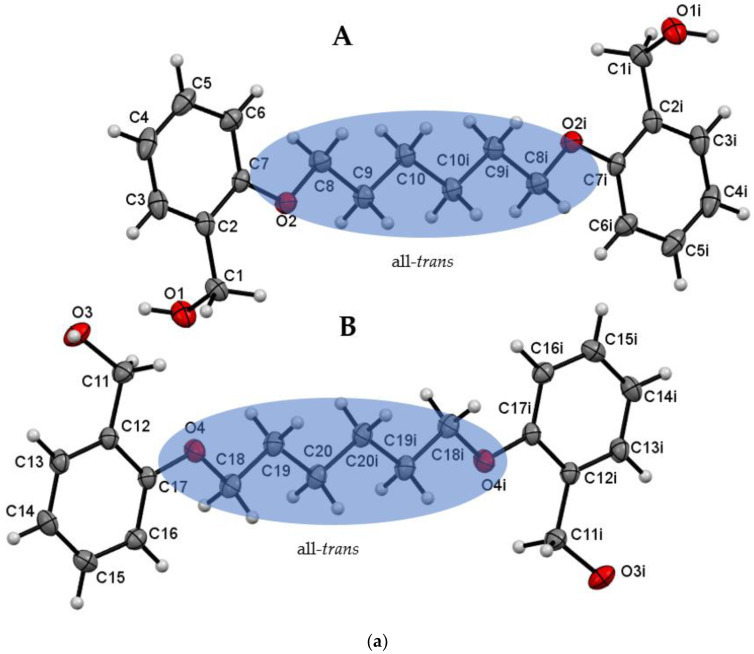
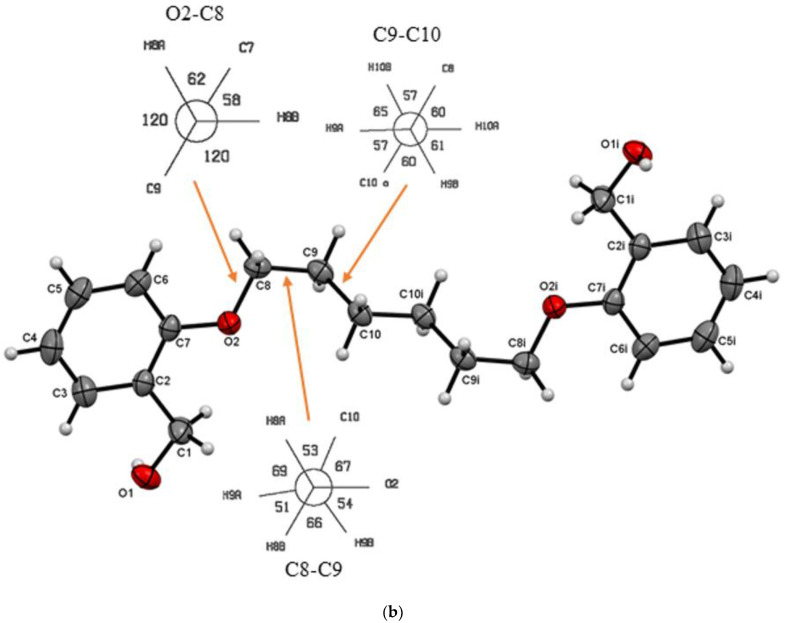
Figure 2.
(a) ORTEP plot of Do6OH I with displacement ellipsoids of non-hydrogen atoms drawn at the 50% probability level (i = -x, -y, -z). The conformation of the aliphatic chain is highlighted by the transparent blue ellipse. (b) ORTEP plot of Do6OH II with displacement ellipsoids of non-hydrogen atoms drawn at the 50% probability level. The representation of the Newman projections of O2–C8, C8–C9 and C9–C10 bonds indicating a partial gauche conformation of the aliphatic chain in Do6OH II (i = -x, -y, -z).


