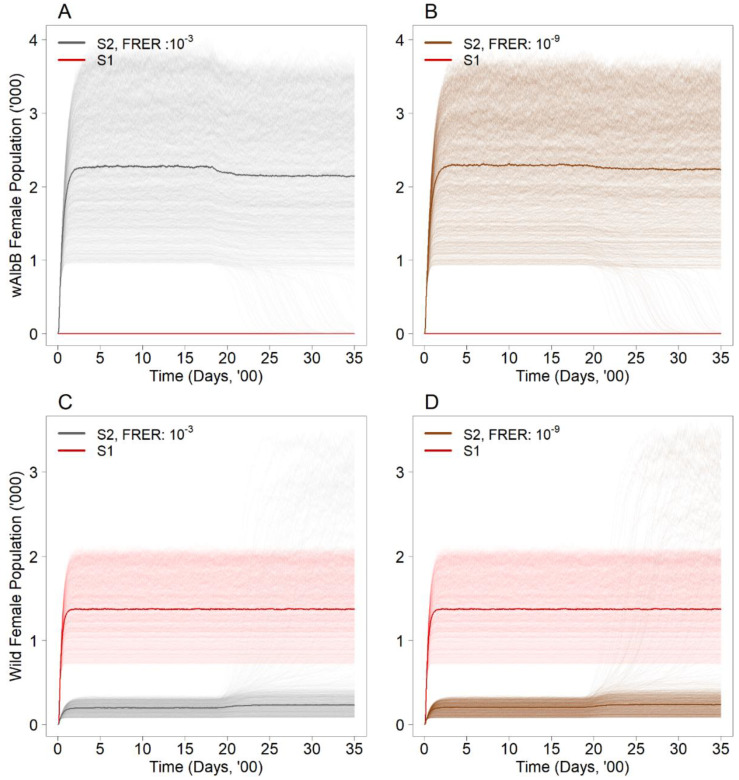
Figure 2.
Number of Wolbachia-infected female mosquitoes (wAlbB) in the population with (A) FRER: 10−3 and (B) FRER: 10−9 under the suppression approach (S2) with the same male release intensity. Number of wild type female mosquitos in the population with (C) FRER: 10−3 and (D) FRER: 10−9 under the suppression approach (S2) with the same male release intensity. The lighter shade solid lines represent the 1000 simulations, and the dark solid lines represent the median of the 1000 simulations. The red solid line represents the baseline scenario (S1).

