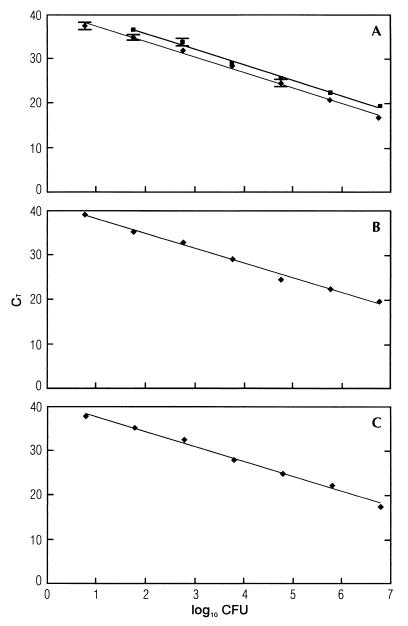
FIG. 2.
5′-Nuclease PCR analysis of serial 10-fold dilutions of L. monocytogenes cells in water (A), skim milk (B), and unpasteurized whole milk (C) purified by BB beads (Genpoint AS) and Dynabead anti-Listeria (Dynal AS). CT values are plotted against the CFU of L. monocytogenes. Template DNA was extracted from samples containing serial 10-fold dilutions of approximately (2.9 ± 0.3) × 108 CFU of L. monocytogenes. The straight lines calculated by linear regression in Dynabead anti-Listeria beads (y = −3.55x [CFU] + 42.8 [■]) (A) and in BB beads (y = −3.33x [CFU] + 44.4 [A], y = −3.49x [CFU] + 43.9 [B], and y = −3.40x [CFU] + 44.1 [⧫] [C]) show square regression coefficients for BB beads of R2 = 0.994 (A) and for Dynabead anti-Listeria beads of R2 = 0.995 (A), R2 = 0.995 (B), and R2 = 0.993 (C). The standard deviations based on three PCRs are indicated.

