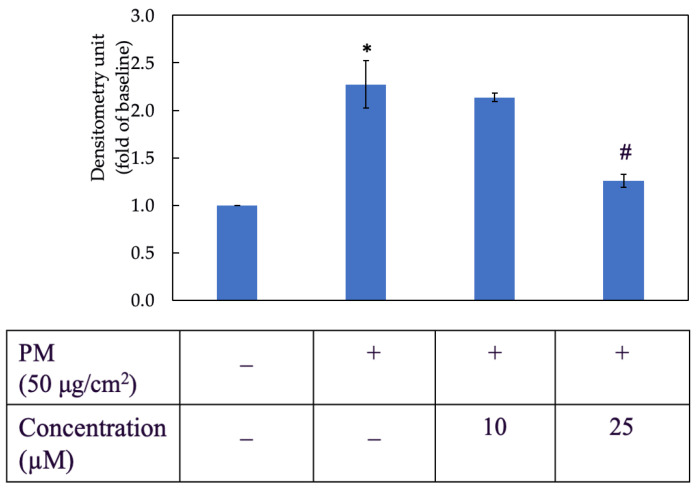
Figure 3.
Effect of morin on PM-induced ROS generation in HaCaT keratinocytes. +, − mean with or without exposing to PM or morin, respectively. Data were presented as mean ± SD and from triplicate experiments. *, # indicates a statistically significant difference with control group (without treating PM and morin) and PM group (only treating PM), respectively, p < 0.05.

