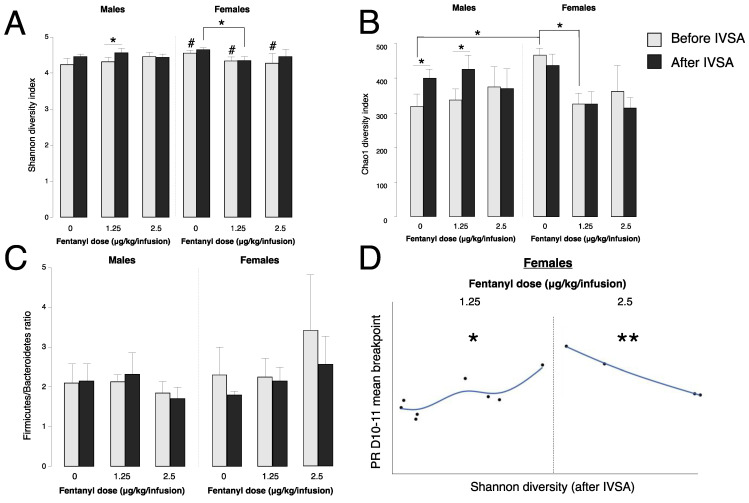
Figure 3.
Alpha diversity of gut bacteria before and after IVSA. (A) Shannon diversity index values of gut bacteria before (gray bars) and after (black bars) IVSA in males and females (error bars represent S.E.M., * p < 0.05, # p < 0.05 vs. males, n = 4–9/group). (B) Chao1 diversity index values of gut bacteria before (gray bars) and after (black bars) in males and females (error bars represent S.E.M., * p < 0.05, n = 4–9/group). (C) Firmicutes/Bacteroidetes ratios before (gray bars) and after (black bars) IVSA in males and females (error bars represent S.E.M., n = 4–9/group). (D) Correlation plots of alpha diversity after IVSA vs. progressive ratio (PR) mean breakpoint on days (D) 10–11 in females at 1.25 and 2.5 μg/kg/infusion (** p < 0.01, * p < 0.05, n = 4–8/group).

