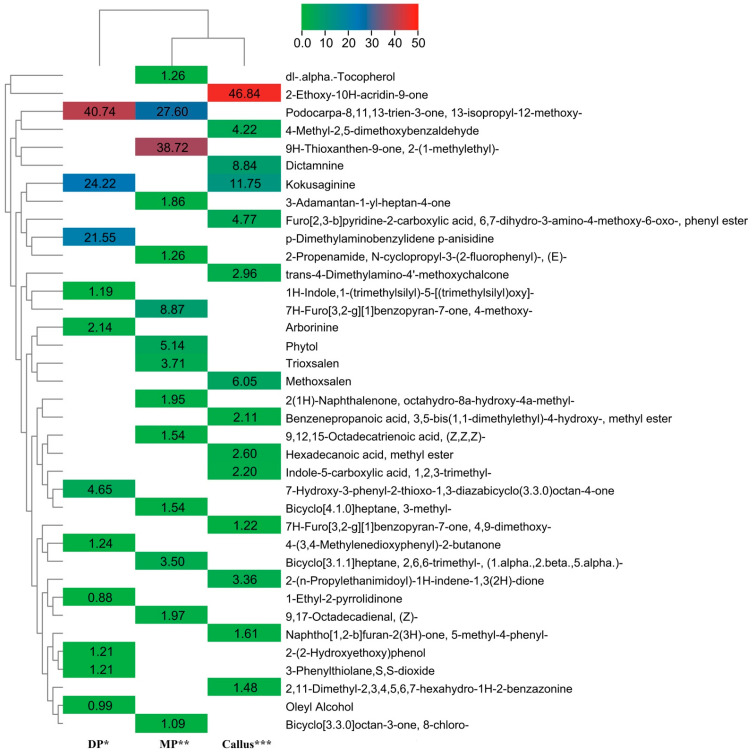
Figure 3.
Cluster heatmap analysis based on the relative levels of phytochemicals measured by GC–MS in R. chalepensis. The magnitude and direction of the correlations are shown by the colors in the matrix boxes. * DP = donor plant growing in soil in the botanical garden; ** MP = ex-vitro-established micropropagated plants; *** callus = callus obtained on MS + 2,4-D (10 µM) + BA(1.0 µM).

