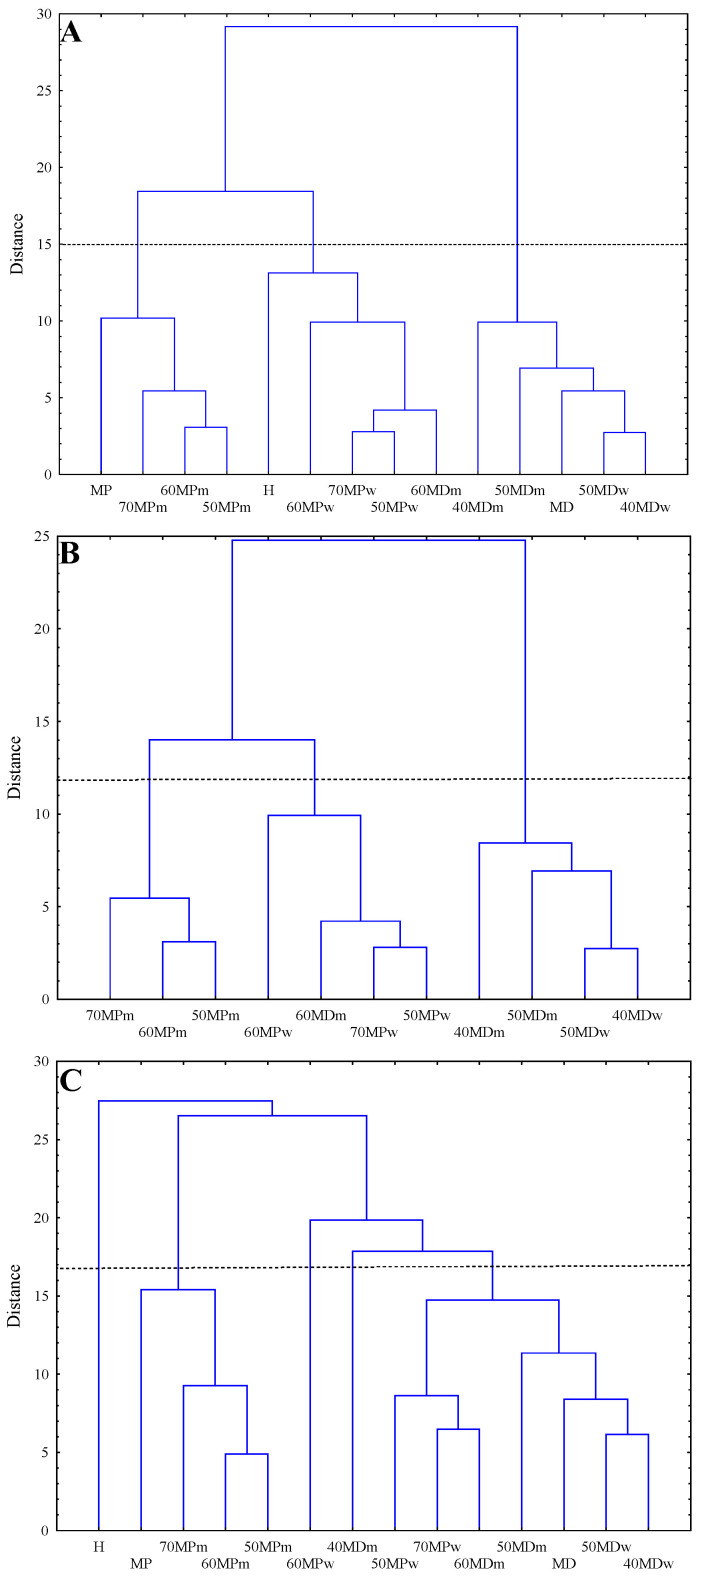
Figure 2.
Hierarchical clustering analysis (HCA) tree diagram. (A)—analysis performed on all 14 samples in the range between 1800–750 cm−1, (B)—analysis performed on 11 samples from II–V group in the range between 1800–750 cm−1, and (C)—analysis performed on all 14 samples in the range between 3600–750 cm−1.

