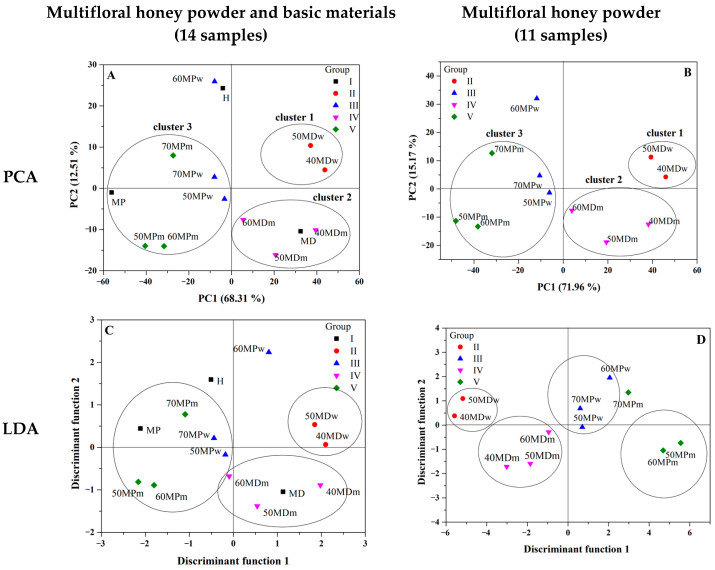
Figure 3.
Principal component analysis (PCA) two-dimensional (2D) score plot (PC1 versus PC2) calculated for the data acquired from the FTIR spectra in the range between 1800—750 cm−1. (A)—analysis conducted for 14 samples (I-V group) and (B)—analysis conducted for 11 samples (II-V group). Linear Discriminant Analysis (LDA) score plot of multifloral honeys of different carrier and diluent by using first three PCs as variables. (C)—analysis conducted for 14 samples (I-V group) and (D)—analysis conducted for 11 samples (II-V group). Range between 1800–750 cm−1.

