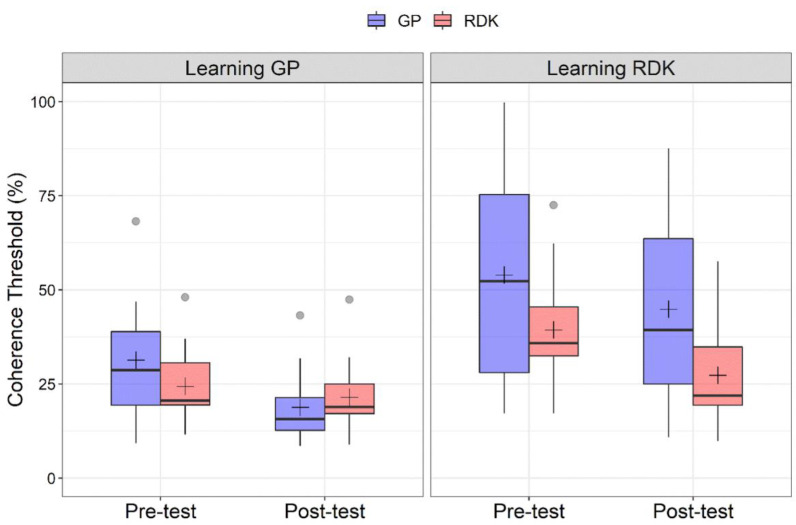
Figure 2.
Boxplots of coherence thresholds (%) for the two types of training. (Left panel) Coherence thresholds for pre- and post-tests relative to the learning Glass pattern (GP) group, for GPs and random dot kinematograms (RDKs). (Right panel) Coherence thresholds for pre- and post-tests relative to the learning RDK group. For each boxplot, the horizontal black line indicates the median, whereas the black cross indicates the mean coherence threshold for that condition. Grey points indicate outliers. Data were plotted using R (v4.1.3; Boston, MA, USA).

