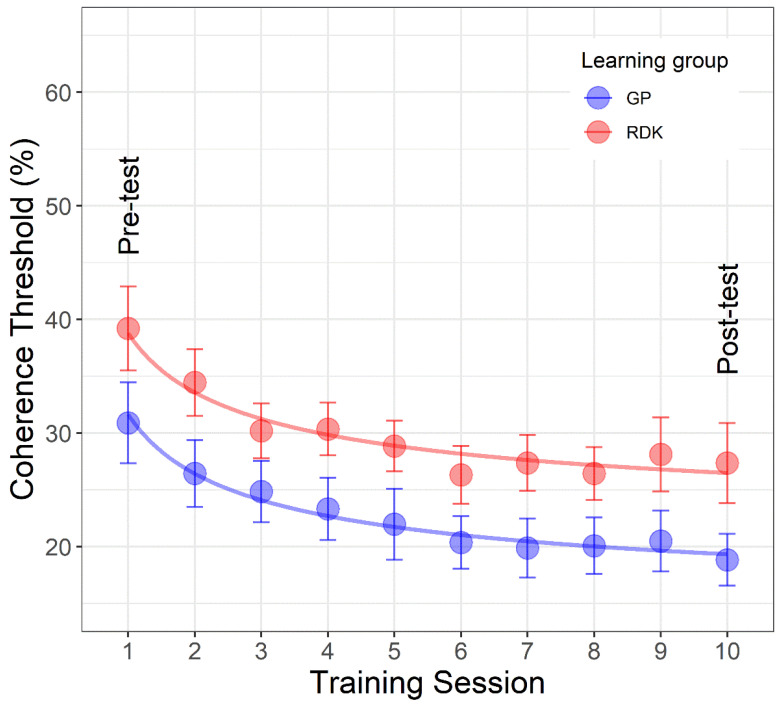
Figure 5.
Mean coherence thresholds as a function of learning sessions separately for each learning group. The first point of each curve represents the pre-tests on the same stimulus used during the training, whereas the last point represents the post-test always on the same stimulus used during the training sessions. The dots in blue color represent the data for translational dynamic Glass patterns (GPs) and those in red for the random dot kinematograms (RDKs). The continuous lines represent the best fitting model (i.e., restricted model 4). Error bars ± SEM.

