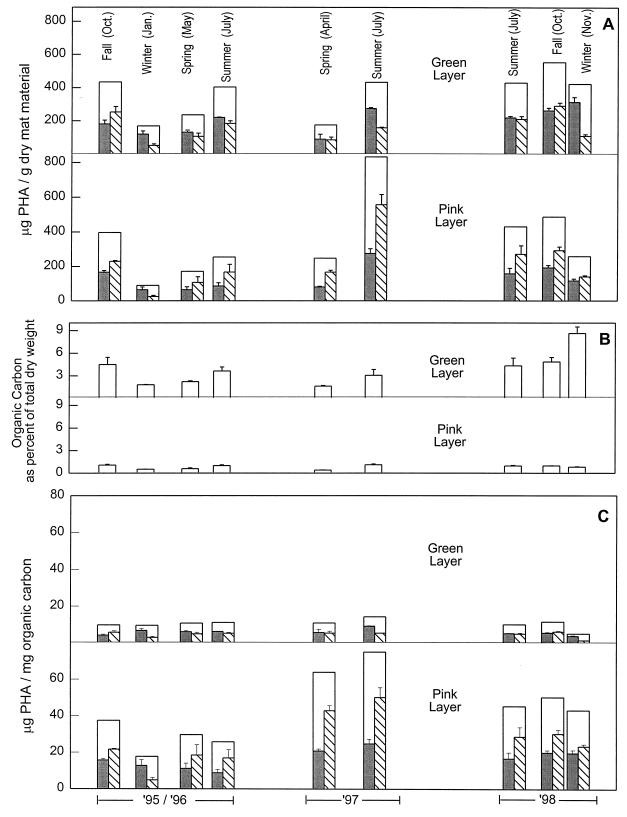
FIG. 3.
Seasonal PHA and organic carbon content of the cyano/green layer, and the PSB/pink layer of stratified microbial mat in Great Sippewissett Salt Marsh. PHA levels (□) are reported as the sum of measured HB ( ) and HV (▧) repeating units. (A) PHA relative to the total dry weight of microbial mat material consisting of sand, biomass, and debris. (B) Organic carbon content of the mat layers. (C) PHA levels normalized to organic carbon. The histograms show means for three replicates and standard deviations.

