Table 2.
Hyperparameters used for Kalman filter.
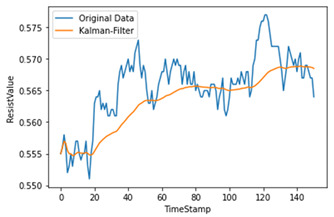
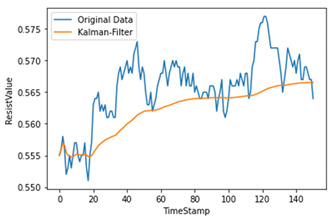
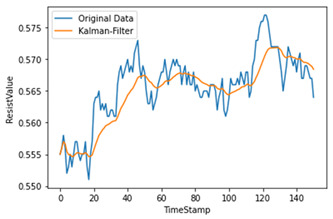
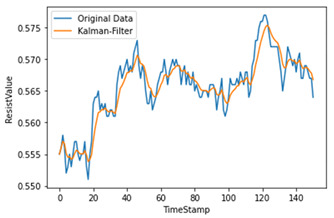
| Q | R | Plot | Explanation |
|---|---|---|---|
| 0.00001 | 0.01 |

|
Significant differences among original data |
| 0.00001 | 0.1 |

|
|
| 0.0001 | 0.01 |

|
Larger Q makes the filtered data close to the original data |
| 0.0001 | 0.001 |

|
Reduces most noise data and is close to original data |
