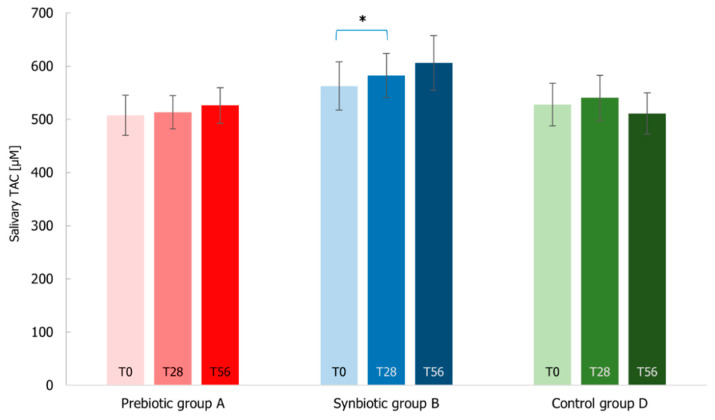
Figure 14.
Salivary total antioxidant capacity (TAC) measured by FRAP assay at T0 baseline, T28 time-point corresponding to the end of the treatment period, T56 time-point corresponding to the end of the follow-up period for Prebiotic (A), Synbiotic (B), and Placebo (D) groups. Values are represented as mean ± SEM. Statistical differences were calculated using Wilcoxon rank-signed test (* p-value < 0.05). The statistical comparison within the synbiotic treatment group is highlighted in blue.

