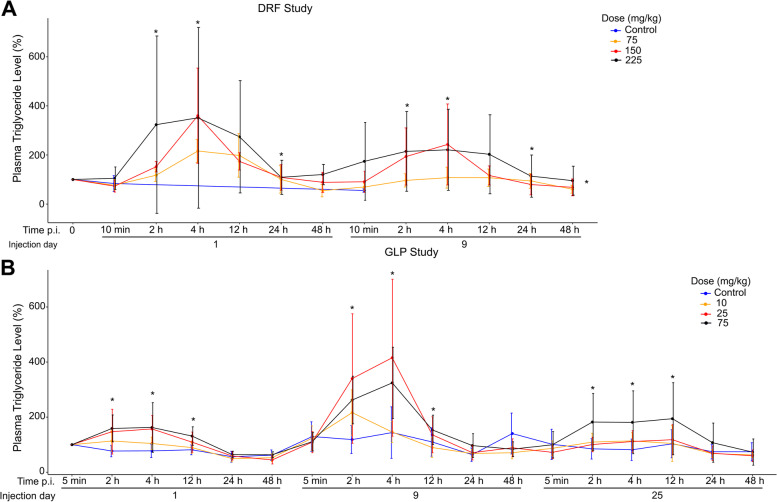
Fig. 4.
Plasma triglyceride levels increased after CS-6253 treatment. A In the DRF study, increase in plasma triglyceride levels was significant at 2 h, 4 h, and 12 h p.i. (p = 0.002, p < 0.001, and p = 0.003, respectively) and for accumulated treatment over time (p = 0.016). B Increase in plasma triglyceride levels in treated monkeys was significant at 2 h, 4 h, and 12 h p.i. in the GLP study (p < 0.001, p < 0.001, and p = 0.050, respectively). The values for the DRF study were shown as percent change from the baseline measurement while the values for the GLP study were shown as percent change from the first measurement point at 5 min p.i. on day 1. The analysis was done using a mixed-effects model, with triglyceride levels modeled as a function of fixed effects including treatment (active compared with placebo), indicator variables for hours since injection (i.e., time of injection) and injection number, and total time under study; a random intercept of subject was specified to model correlated outcomes arising from repeated measurements

